NC-GAP Final Report
 |
||
| Download Final Report PDF |
|
|
||
| Download Final Report PDF |
Executive Summary
The Gap Analysis Project is a national program with the mission of developing key datasets needed to assess biological diversity across the nation. The North Carolina Gap Analysis Project (NC-GAP) was a state affiliate based at the North Carolina Cooperative Fish and Wildlife Research Unit and charged with developing those data for the state. The goal of the NC-GAP project was to assess the distribution and conservation status of biodiversity in the state under existing land ownership and management regimes. The specific objectives were to:
| 1) | Map the land cover of North Carolina |
| 2) | Map the predicted distributions of terrestrial vertebrates that use habitat in the state during the breeding season |
| 3) | Map the network of conservation lands in the state (land management stewardship) |
| 4) | Assess the conservation status of both the terrestrial vertebrates and the natural vegetative communities of the state |
| 5) | Provide that information to natural resource agencies so they can use it in their conservation planning efforts |
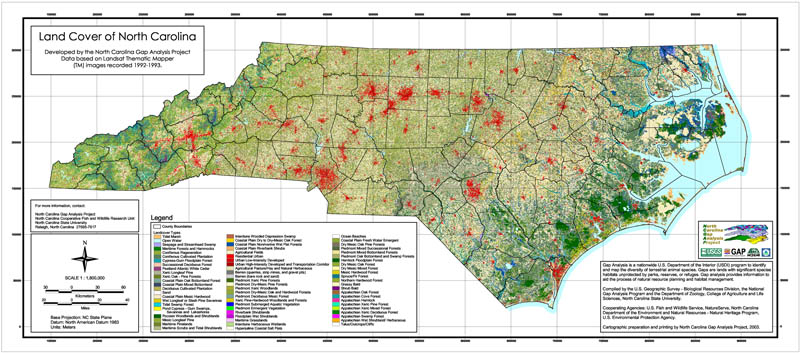
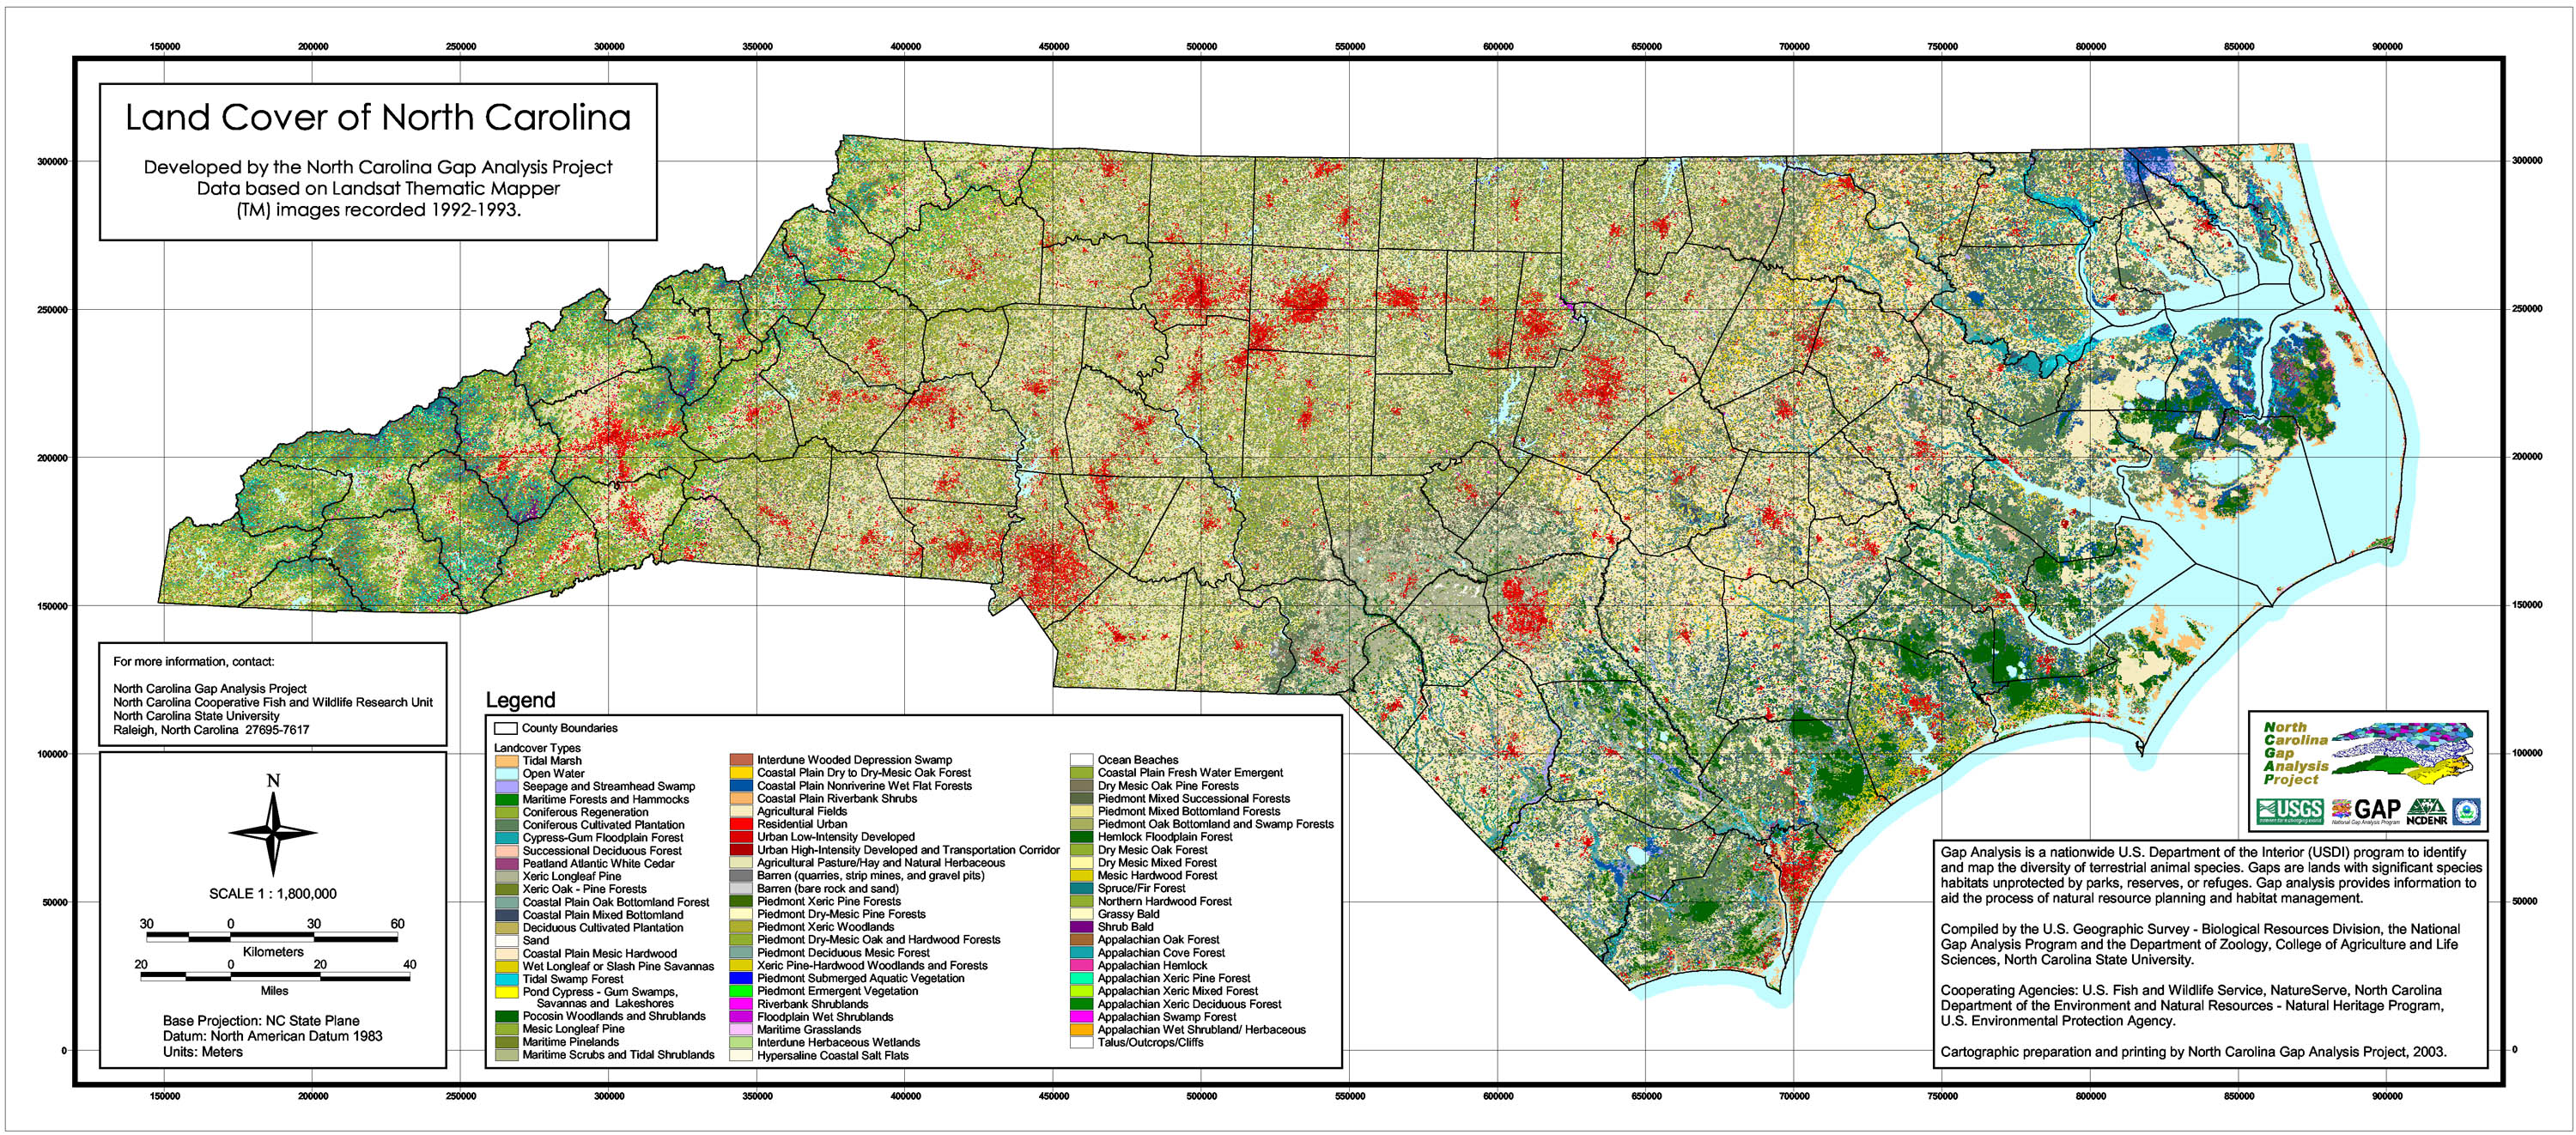
Land Cover
A map of North Carolinas land cover was developed using Landsat TM satellite imagery acquired in 1991 and 1992. Processing was completed on each of 13 mapping zones, which were created by intersecting the primary ecoregional provinces (Coastal Plain, Piedmont, Sandhills, and Blue Ridge) with 12 satellite images covering the state. Reference data for the land cover mapping effort were acquired through aerial survey, field reconnaissance and from existing datasets. These data were used in the development of decision rules for the detailed land cover mapping. General land cover types, including water, row crops, pasture, urban, and barren types, were integrated from the National Land Cover Dataset (USGS 1997). The NC-GAP Land Cover classification includes 69 map classes, 59 of them representing natural and semi-natural land cover classes dominated by vegetation. Natural vegetation map units were based on a classification system that was intermediate between the National Vegetation Classification System (NVCS; Grossman et al. 1998) and the recently developed NatureServe Ecological Systems Classification (Comer et al. 2003).
 | |
| JPG Version 1.4mb (3000 x 1322) | TIF Version 6.4mb (6064 x 2672) |
The statewide land cover map showed that upland forests, including deciduous, mixed, and evergreen types represent just over half of the states land cover (51 %). A quarter (25 %) of the land cover is cultivated herbaceous, the majority of which is row crop. Ten percent of the state was classified as wetland, the vast majority of that being the wetland forests of the Coastal Plain region. Statewide, the two most extensive natural/semi-natural cover classes are Piedmont Dry-Mesic Oak Hardwood Forest (7 %) and Coniferous Cultivated Plantations (7 %), which cover 981,400 and 966,200 hectares respectively. The most extensive wetland forest type was Pocosin Woodland and Shrubland, which represented 3 % of the state.
Both spatial and thematic accuracy assessments were completed for the statewide land cover dataset. The 95% confidence interval for the total spatial error in the land cover map is 20.6 ±5 meters (Easting 38 ±5 meters, Northing 27 ±5 meters). Thematic accuracy was tested at two levels of detail. A general classification was based on cross-walking the detailed cover classes into 15 general land cover categories and the second assessment was done for the detailed land cover classes. Overall accuracy for the generalized land cover was 87.7 %, with a 95% confidence interval of 84.9 to 90.6 %. The estimated per class accuracies in the detailed cover classes were highly variable, and the overall accuracy for the full 69 class land cover map is 58.5 %, with a 95% confidence interval of 57.1 to 59.9 %. The final accuracy assessment was based on the 10,620 interpreted points, and calculations were based on marginal frequencies (Card 1982), which takes into account both the number of samples in a class and the area of the cover class in the final map. The estimated Kappa statistic for the detailed land cover is 0.73.
Terrestrial Vertebrate Distributions
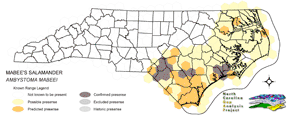
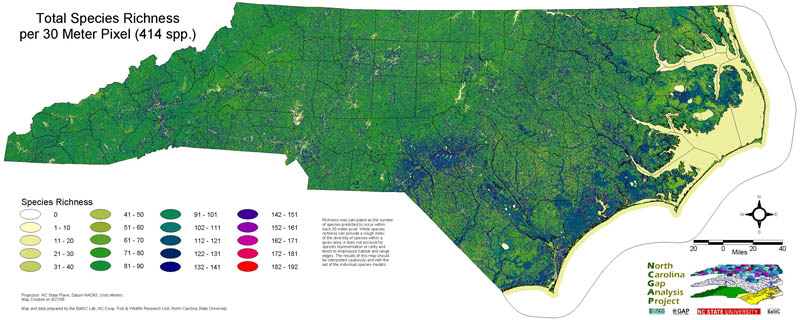
Potential distribution maps were developed for 414 terrestrial vertebrate species comprising 193 species of breeding birds, 75 species of mammals, 76 species of amphibians, and 70 species of reptiles. Included species were those that were established during the breeding season within the state. Range limits of each species were delineated on a grid of 258 hexagons encompassing the state (White et al. 1992). Three information sources observation date, published range maps, and expert review - were utilized to generate range limits. Point data used to create range limits included 748 point localities from the NC Museum of Natural Sciences (NCMNS), 2,028 points from the NC Natural Heritage Program (special concern species only), as well as 27,210 point localities that were newly mapped for this project. The newly mapped points include 25,001 records from the NC Breeding Bird Atlas dataset along with NCMNS specimen records for birds (193 points), mammals (627 points), and herptiles (1389 points). Twenty five biologists from state, federal, and non-profit conservation organizations were engaged as reviewers of draft range maps. Habitat relationship information was compiled from published literature into a relational database, where spatial models of predicted distribution were created based on the GIS datasets available.
| Hexagonal Known Range: | Predicted Distribution: | |
 |
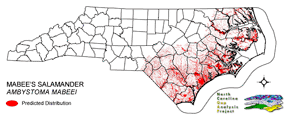 |
The accuracy of the vertebrate potential distribution models was assessed by comparison of available species lists for National Wildlife Refuges, National Seashores, and National Parks, as well as North Carolina State Parks and Preserves. The percent agreement averaged 78.8 %, 64.4 %, and 72.8 % for birds, mammals, and herptiles, respectively. While species lists were readily available for birds throughout the state (11), very few compiled lists exist for mammals and herptiles (3). Error rates were low for omission (5.6 %, 3.1 %, and 2.1 %), whereas, commission rates were significantly higher (15.6%, 32.4 %, and 25.1 %).
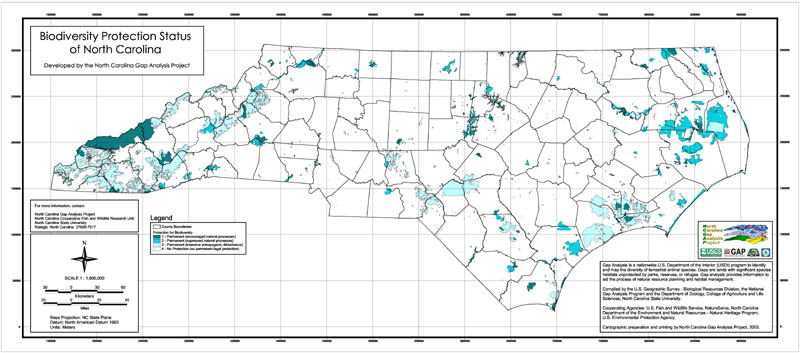
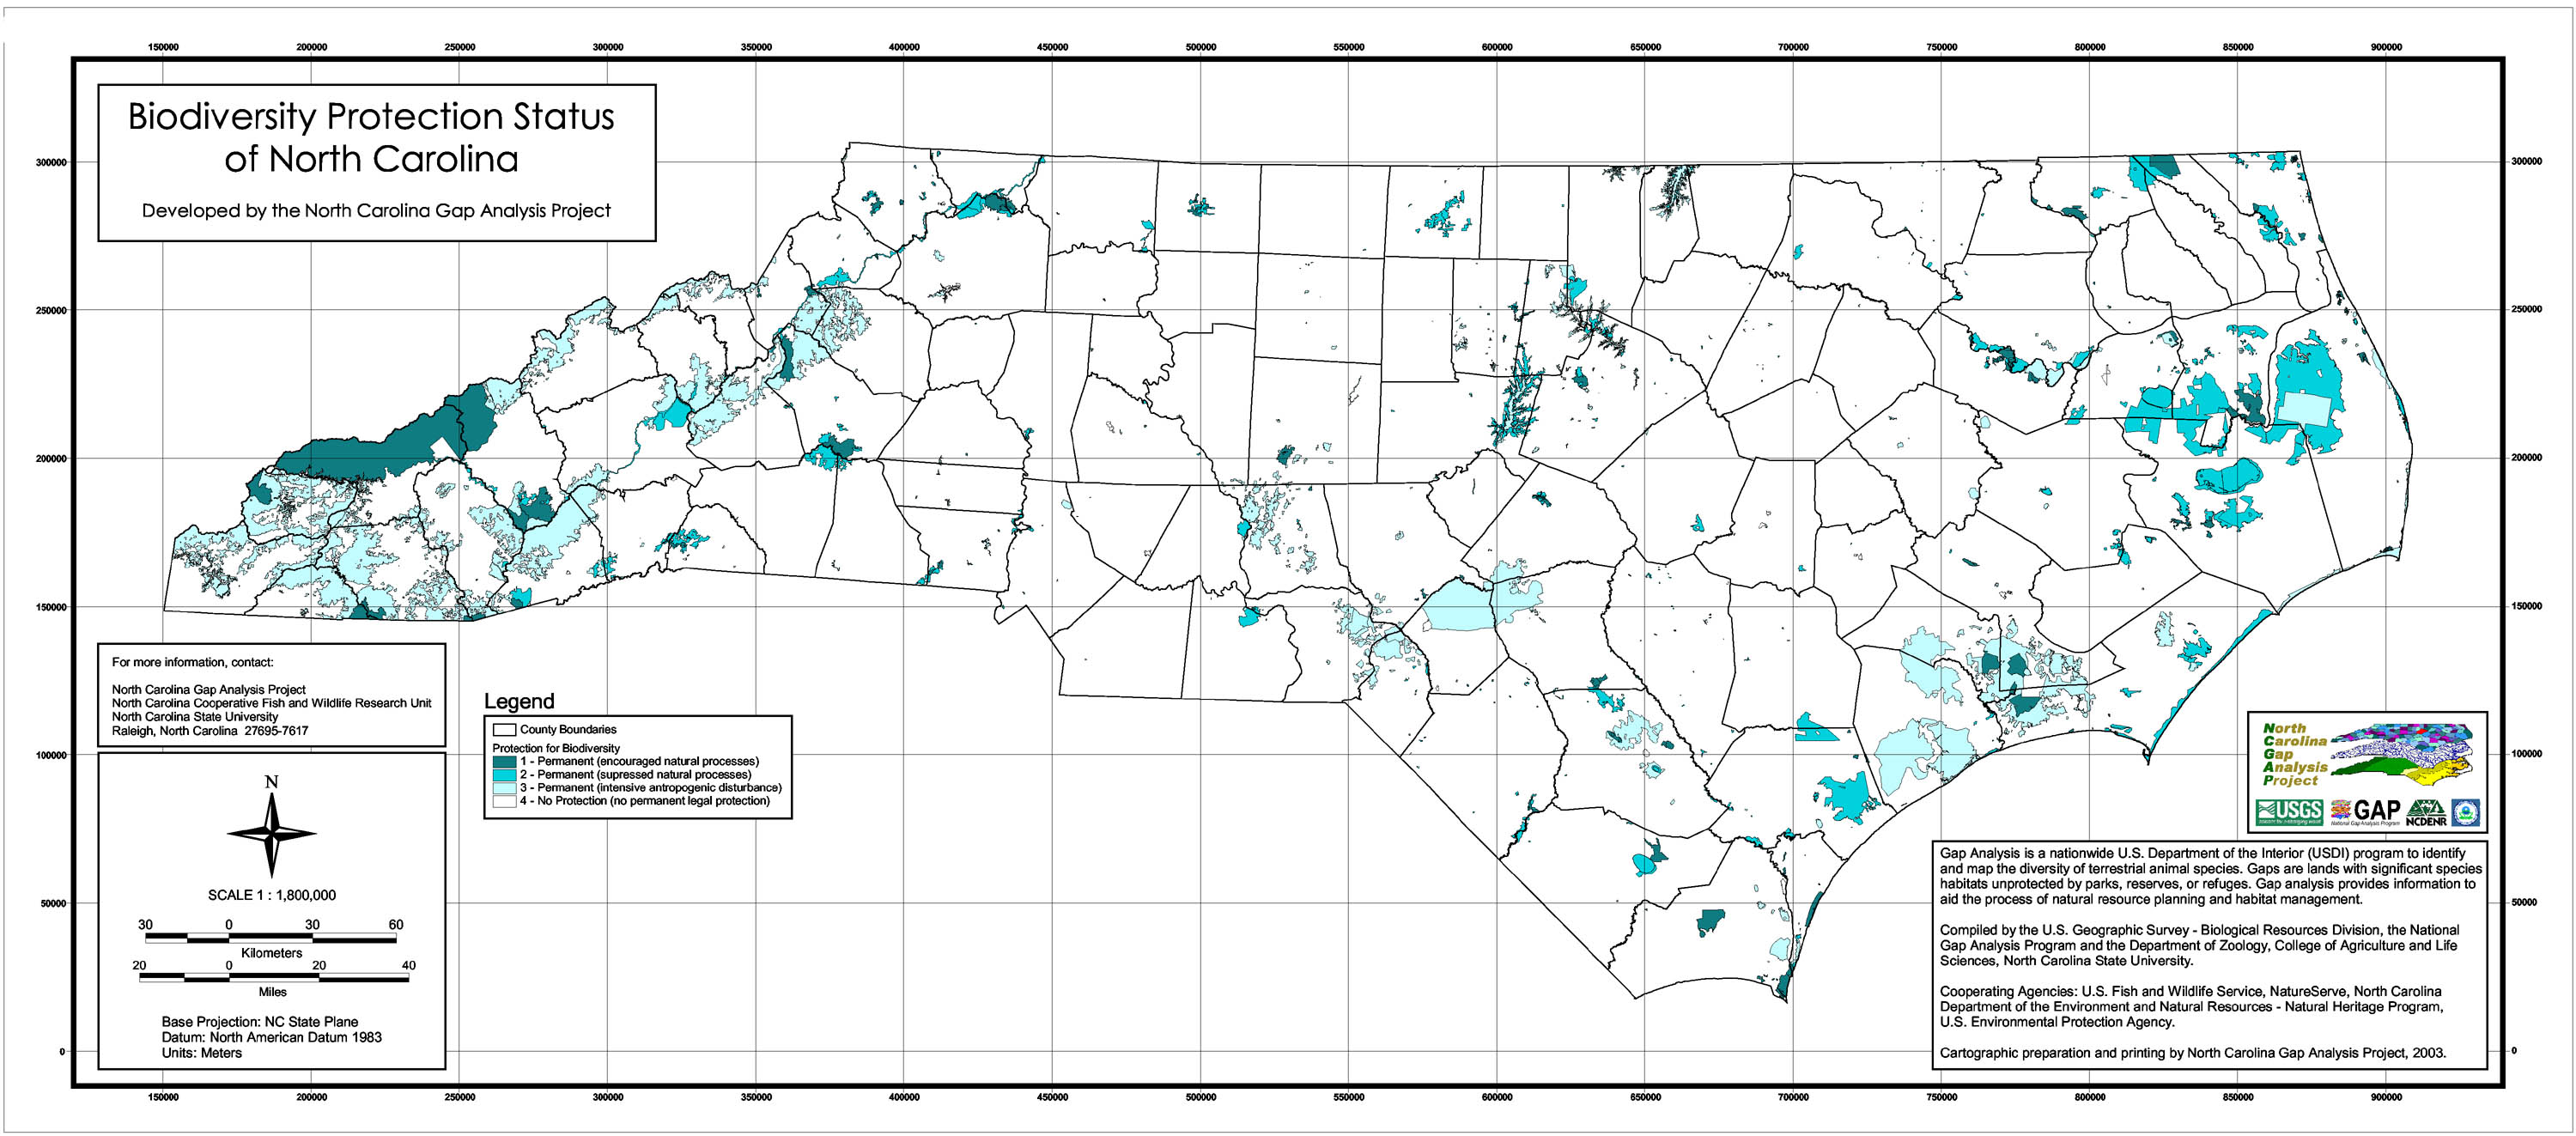
Land Stewardship
In order to assess the protection of vegetation types and the vertebrate species, NC-GAP compiled the existing management datasets from the Natural Heritage Program, the Wildlife Resources Commission, and the Center for Geographic Information and Analysis. Each stewardship polygon was assigned a GAP Status code, which represents the permanence and intent of the management based on information in management plans or agency mandates for specific land units. Status 1 and 2 represent permanently protected lands that are managed for biological diversity, with Status 1 representing the highest level of protection. Status 3 lands are those lands under a management plan that prevents conversion to non-natural cover types but allows either intensive local or extensive resource extraction, and Status 4 represent those lands that are not managed for biodiversity or are not under a management plan.
 | |
| JPG Version 0.6mb (3000 x 1322) | TIF Version 0.8mb (6064 x 2672) |
The analysis of land stewardship showed that a relatively small proportion of the state is under any sort of protection for biodiversity. In fact, approximately 10 % (1,297,516 hectares) of the state was under management, with the majority of that (7.6 % or 969,940 hectares) being federally managed. State management represented 2.2 % of the state (277,064 hectares). A total of 37,413 hectares (0.3 %) of Non-Governmental Organization (NGO) lands had been mapped through a variety of mapping projects and were included in this dataset, but we know that this is an underestimate for the state, and that those lands will become increasingly important for natural resource management over time. The pattern of land ownership is highly skewed across the state, with the vast majority of public lands being in the outer Coastal Plain and mid to high elevation mountains.
Lands with high protection for biodiversity (GAP Status 1 or 2) only comprised slightly over 4 % (213,841 ha) of North Carolinas land. Federal management, primarily by the National Park Service, U.S. Forest Service, and U.S. Fish and Wildlife Service, accounted for the majority of the status 1 and 2 lands. Status 3 lands were managed predominantly by the U.S. Forest Service (459,081 ha) and the Department of Defense or Department of Energy (153,363 ha).
Gap Analysis
Six of the 59 natural cover types in the state have less than 1 % of their distribution on Status 1 and 2 lands. These types include four cover types of the Coastal Plain: the Xeric Longleaf Pine Woodland, Coastal Plain Xeric Oak Pine Forests, Coastal Plain Mesic Hardwood Forest, and the Coastal Plain Dry to Dry Mesic Oak Forests. The other two cover types are Piedmont types. These include the Piedmont Mixed Successional Forests and the Oak Bottomland Forests and Swamps. Another 25 natural cover types in the state have less than 10 % of their mapped distribution in Status 1 and 2 lands. In the west the high elevation areas with greater than 50 % of their distribution in Status 1 and 2 lands represent the Spruce-Fir forests. Despite the high percentage of their distribution on conservation lands (69.9 % of the extant distribution) these forests and the fauna dependent on them are declining due to a complex interaction between biotic and abiotic factors, including acid deposition, balsam wooly adelgid, drought, and other factors (Tingley et al. 2002, Smith and Nicholas 1998, Johnson 1992, Aber et al. 1989). It is important to note that the Gap Analysis for existing vegetation does not account for the previous losses in acreage, thus even cover types with greater that 20 % of their extant acreage in the conservation network can represent types that have undergone a severe decline in representation (Noss et al. 1995, Frost 1993).
Of the 414 species modeled, 45 have less than 1 % of their predicted distribution on lands with long-term protection for biodiversity (GAP status 1 and 2). Thirty of these are birds, six are mammals, and nine are reptiles. In addition, NatureServe and the North Carolina Natural Heritage Program rank 14 of the 45 species as either critically imperiled (SRank 1), imperiled (SRank 2), or vulnerable (SRank 3) in the state.
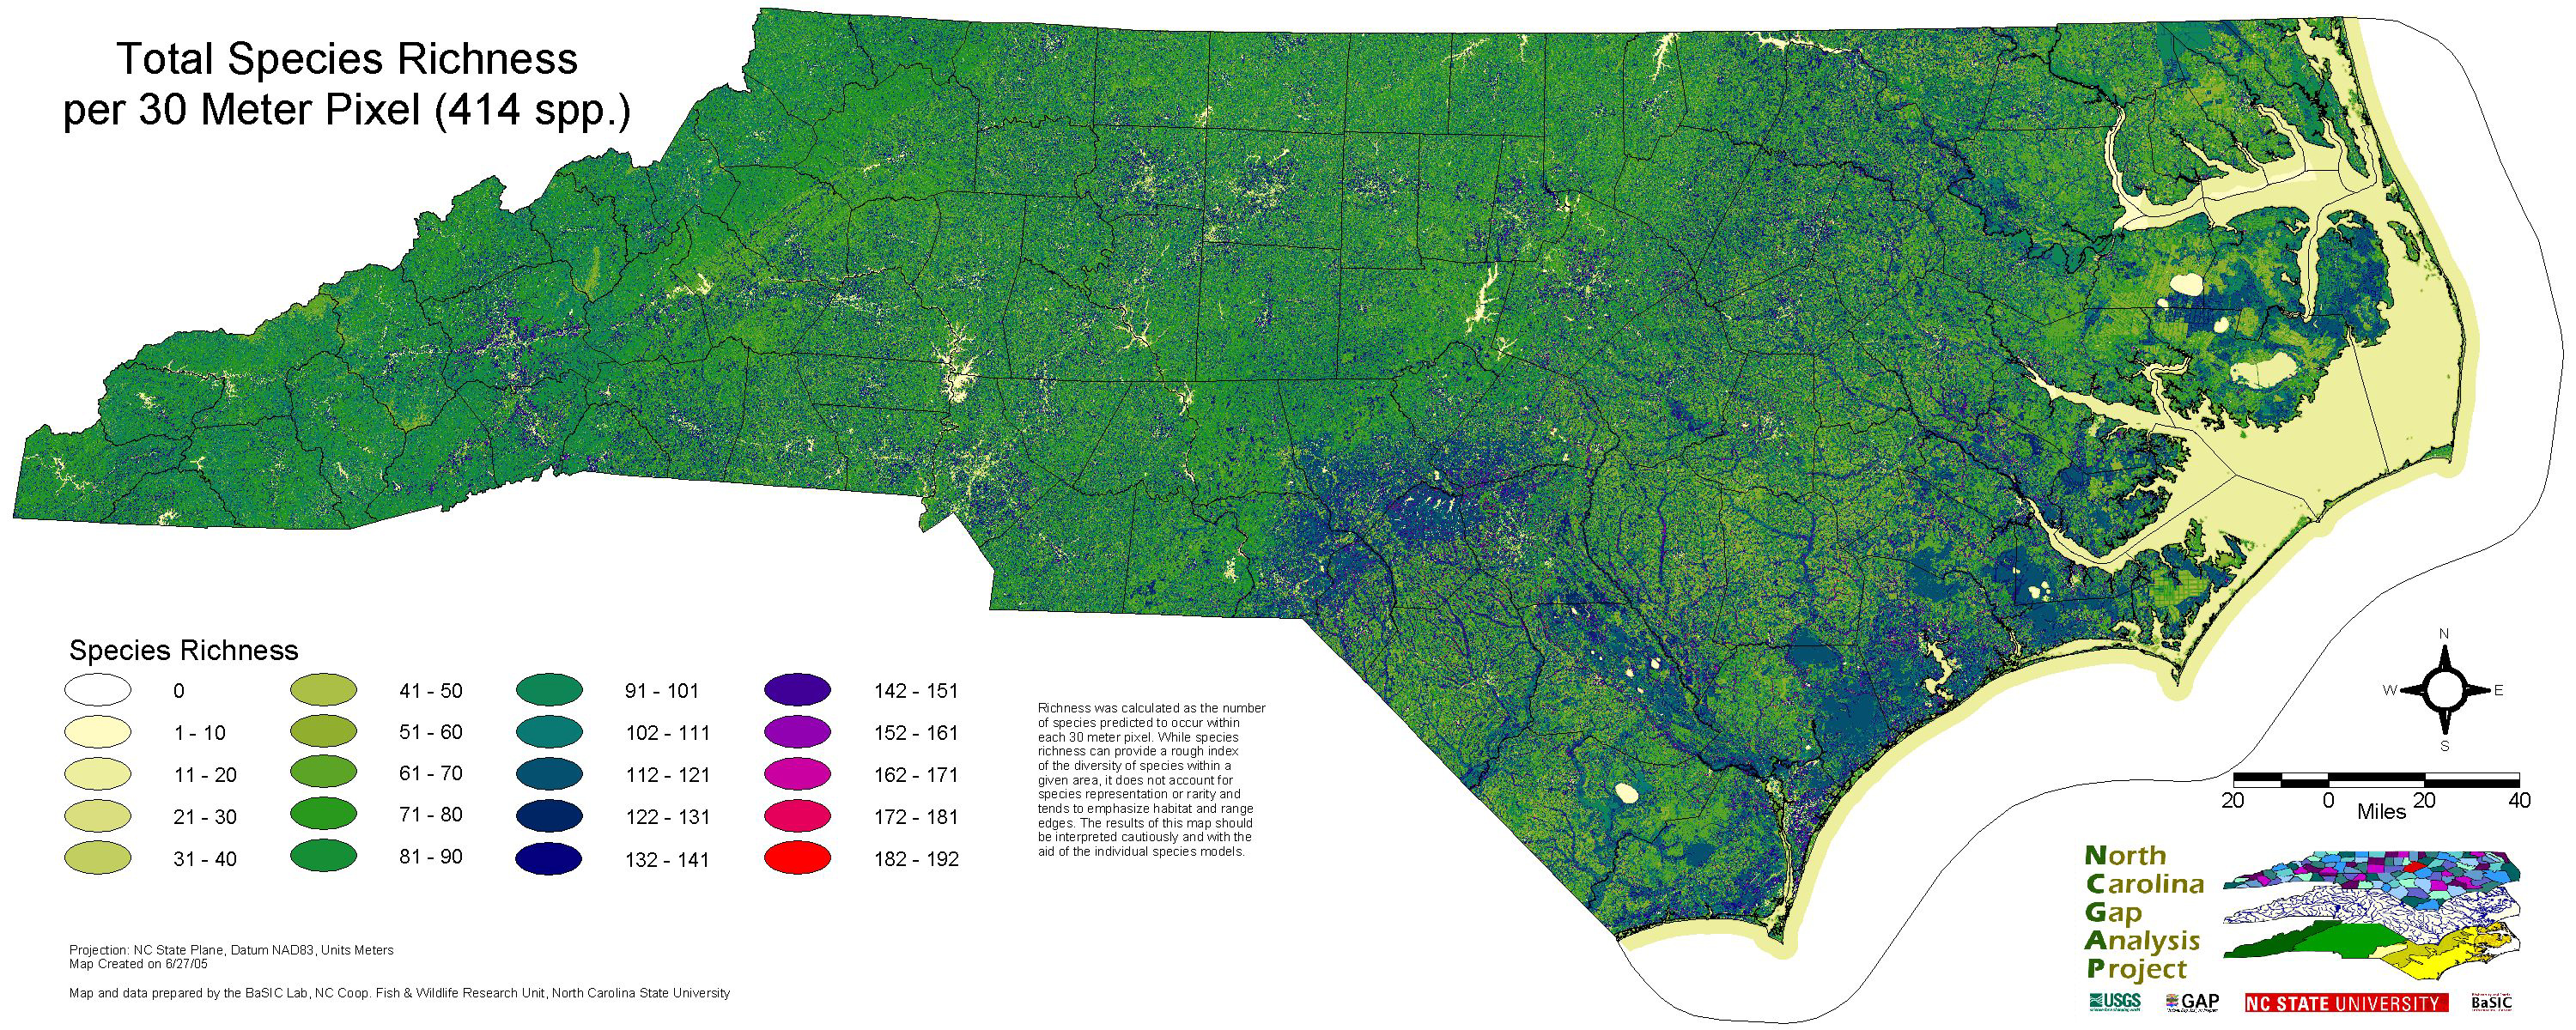
Overall species diversity is concentrated along the outer Coastal Plain, with other high-ranking areas including the Sandhills and the Asheville basin. Diversity in the Sandhills and Coastal Plain seem to be tied to wetland habitats; whereas, the Asheville basin probably is highlighted due to the range in elevation, topography, and land use of the area. For avian species, the Blue Ridge escarpment and the Outer Coastal Plain stand out as areas of high diversity. High elevations throughout the southern Blue Ridge represent hotspots for mammalian species diversity. Amphibian species diversity is very closely tied to the Coastal Plain riverine and wetland systems. This pattern highlights the role of wetland habitat in the outer Coastal Plain and Sandhills. For reptiles, the Sandhills region and xeric pine woodlands in the Coastal Plain stand out as the hotspots.
 |
| JPG Version 4.0mb (3000 x 1200) |
Outreach
In order to get the information for the North Carolina Gap Project into natural resource managers hands, we worked in cooperation with the U.S. Fish and Wildlife Service personnel on the Roanoke-Tar-Neuse-Cape Fear Ecosystem Team to build a decision support tool. The GEDE Tool allows non-GIS-savvy users to view data quickly and conduct advanced queries. While the GEDE Tool has been designed to be accessible to a broad audience, it is based on a full implementation of ArcView with Spatial Analyst, and thereby, provides an advanced GIS platform for those who wish to expand the complexity of their queries and analyses. The central scripting used in the tool allows us to import our statewide data as well as other state Gap products into the tool for use by a broad audience. In addition to the tool, an interactive website, including download options for county, watershed, and state datasets, should facilitate the distribution to agencies and managers.
Partners in data development for the project included the NatureServe Southeastern Office, North Carolina Natural Heritage Program, North Carolina Wildlife Resources Commission, North Carolina Museum of Natural Science, North Carolina Center for Geographic Information and Analysis, North Carolina Division of Coastal Management, and the Center for Earth Observation. Agencies actively involved in the dissemination and use of the data specific analyses included the United States Fish and Wildlife Service (Refuges), United States Fish and Wildlife Service (Ecological Services), North Carolina Natural Heritage Program, North Carolina Wildlife Resources Commission, North Carolina, and the North Carolina Division of Forestry.
For more information on the NC-Gap Analysis Project, see the full final report pdf.
Recommended Citation:
McKerrow, A.J., S.G. Williams, J.A. Collazo. 2006. The North Carolina Gap Analysis Project: Final Report. North Carolina Cooperative Fish and Wildlife Research Unit, North Carolina State University, Raleigh, North Carolina. xiv + 110 pp. + appendices.