<previous next> play stop
Online GAP Data Explorer Tool Tutorial
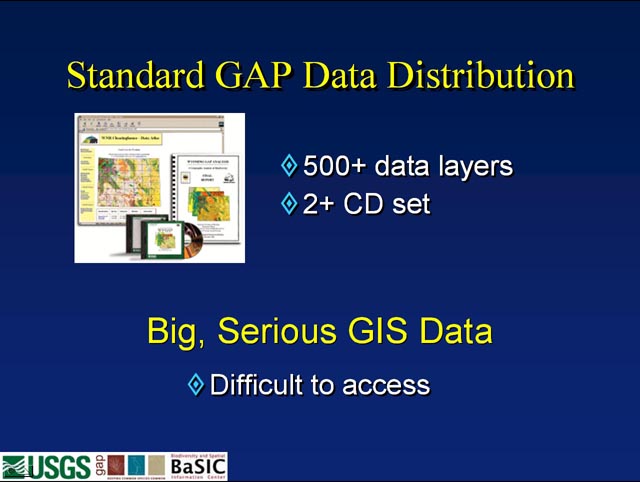
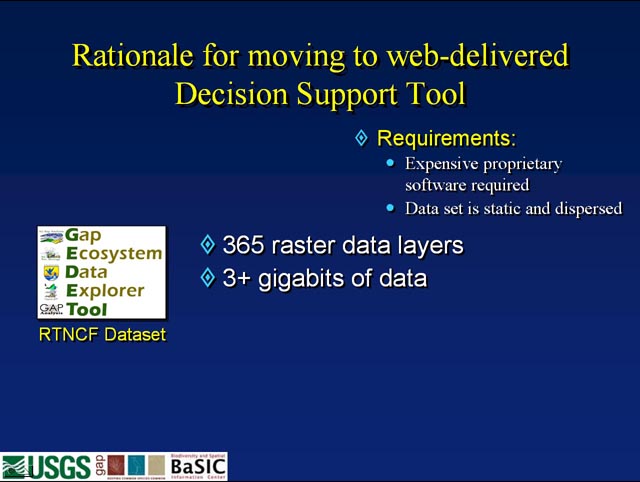
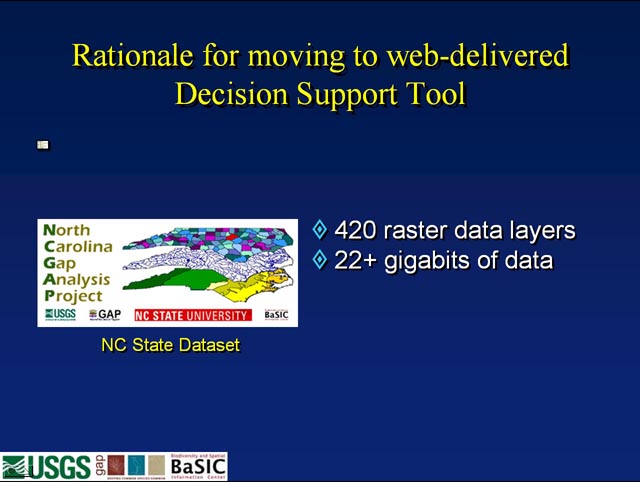
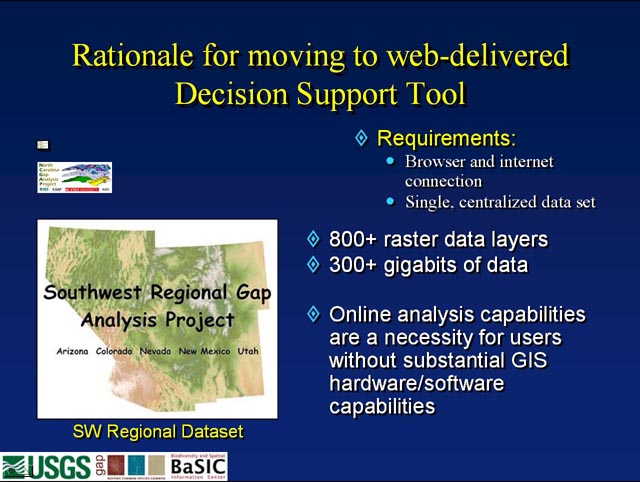
Moving to a web-based tool is a necessity given the size of the datasets in state, much less, regional datasets. A web-based solution also is appealing due to the software requirements – all users need is a modern web browser and an internet connection.
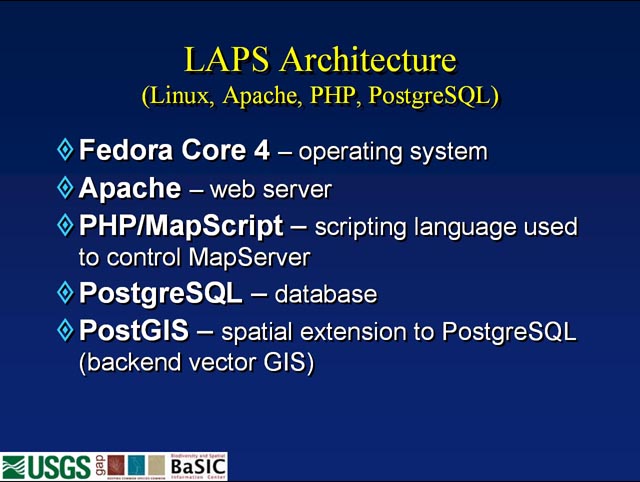
The server for the tool is built entirely from open source software – from the OS to the backend vector and raster engines.
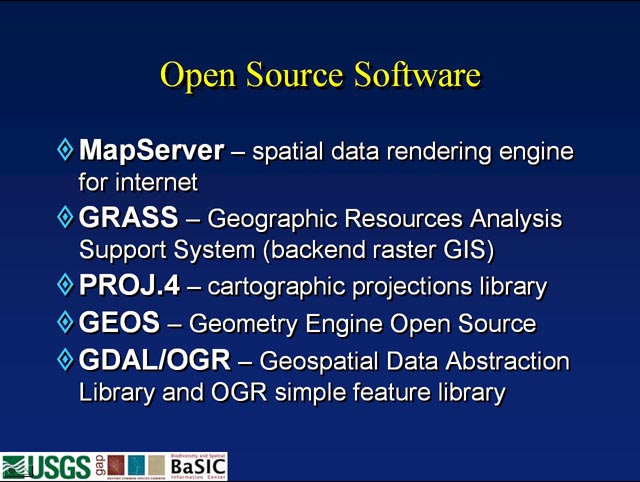
Open source software used.
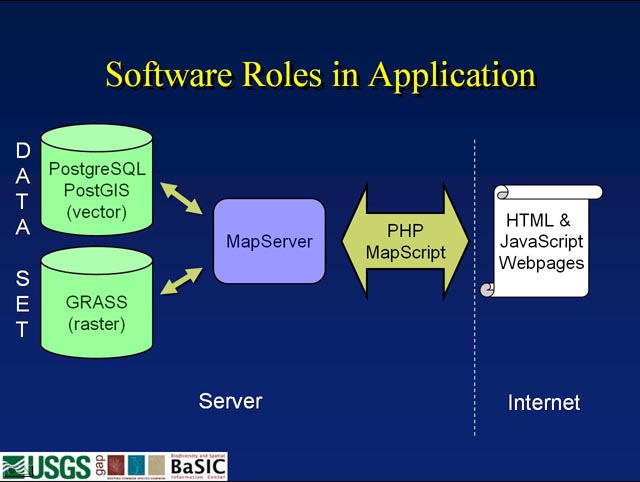
Graphical representation of data flow.
This is greatly simplified, but the concept is still there.
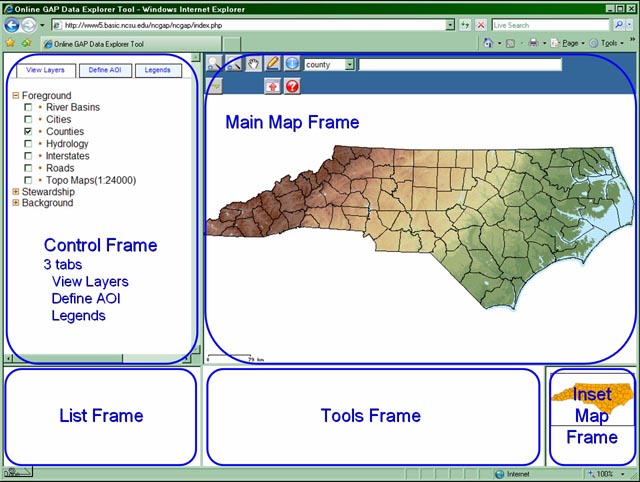
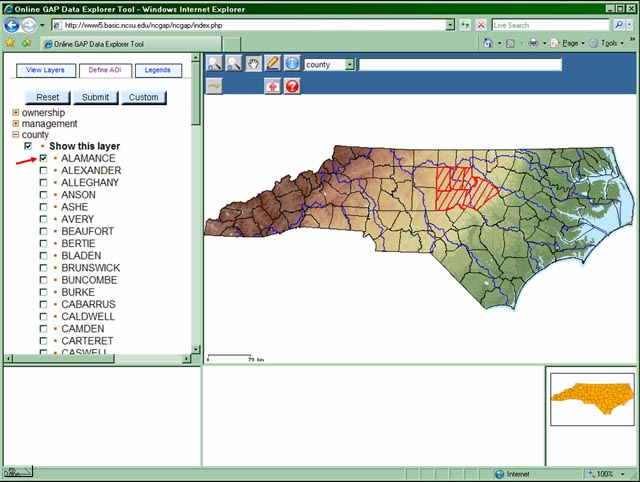
The initial view is standard with five frames. 1) Control Frame - three tabs are presented in the main dialog frame- View Layers, Define AOI (Area Of Interest), and Legends. It provides the user control over what the map contains through a series of dialogs once an AOI is selected. 2) Main Map Frame - contains the main map as well as several map tools (pan, zoom, query, etc.). 3) List Frame - contains the list of species that occur within the AOI. 4) Tools Frame - contains the tools for individual species once one is selected from the List Frame. 5) Inset Map Frame - contains full extent view with a polygon depicting where the Main Map located.
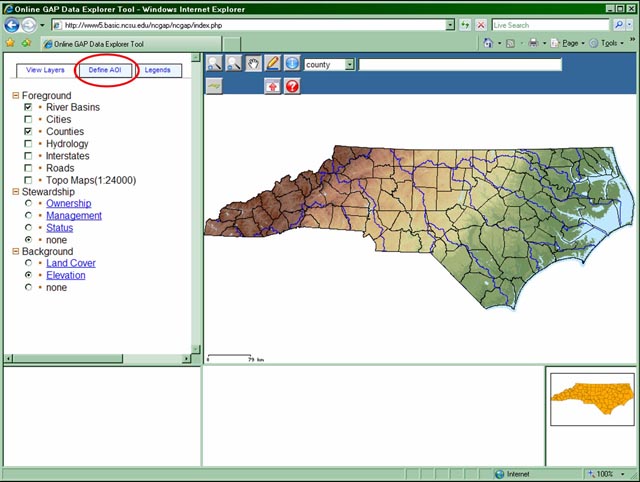
The user can alter the map by selecting the layers presented on the View Tools tab. For example, adding River Basins. To continue the user then must select the Define AOI tab.
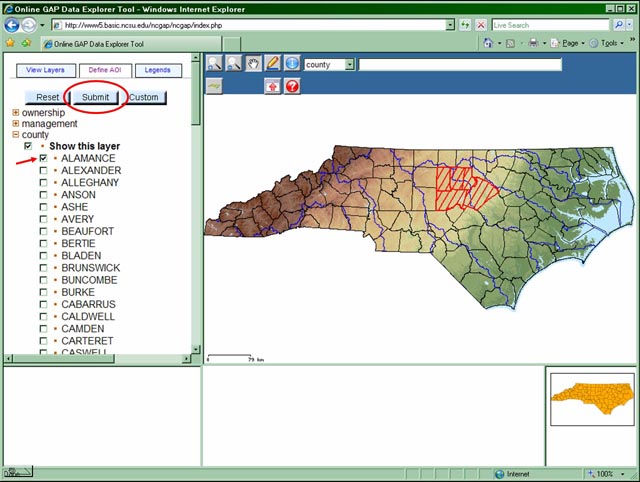
The define AOI tab presents the user with three ways to define their AOI. 1) Selection of predefined polygon boundary data (i.e. county, subwatershed, management, bird conservation region, etc.), 2) Import existing shape file to define the AOI, 3) Onscreen digitizing to create a custom AOI.
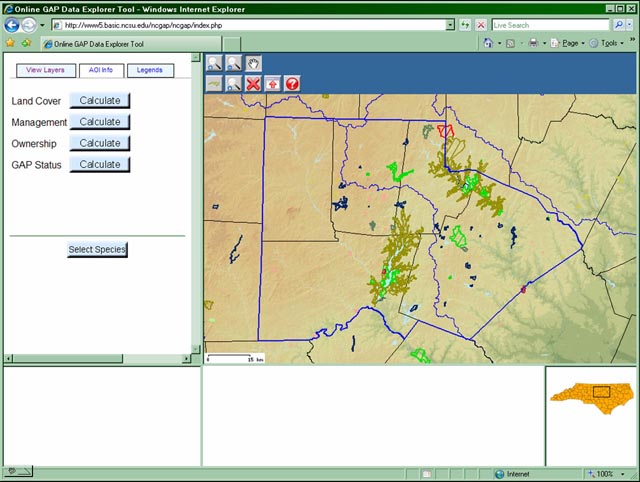
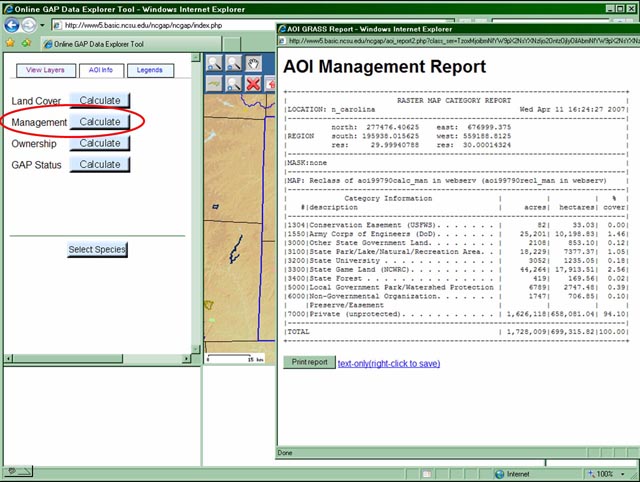
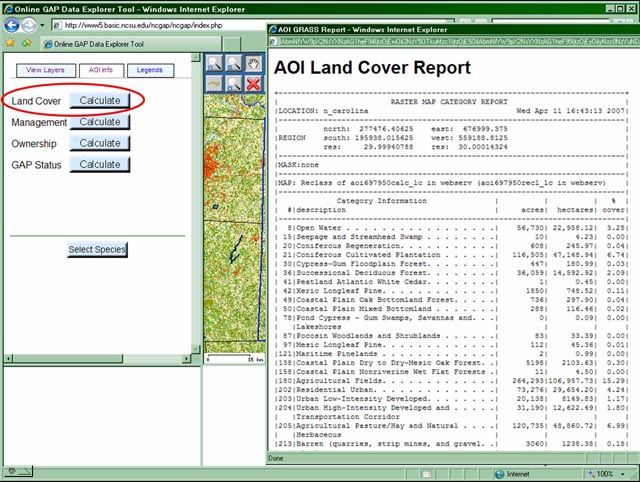
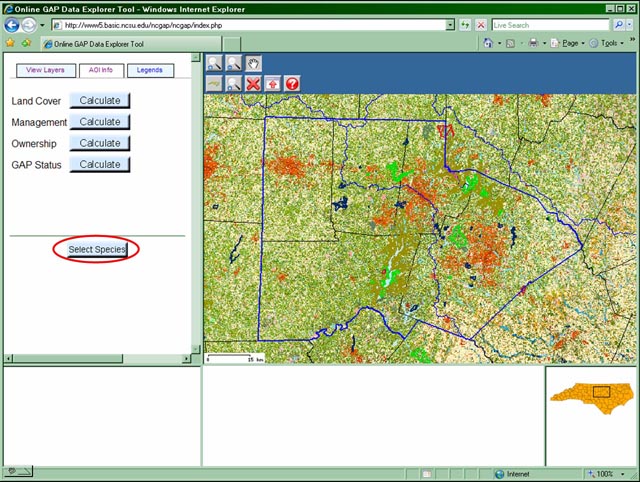
Once the AOI selection is submitted, the Main Map will zoom to the AOI. The ability to quantify four GAP data layers (Land Cover, Management, Ownership, and GAP Status) are presented. By selecting “calculate” for any of these data sets, a report is generated summing the acres, hectares and percentages of each class present in the AOI. The user is also presented with the Select Species button to continue their session.
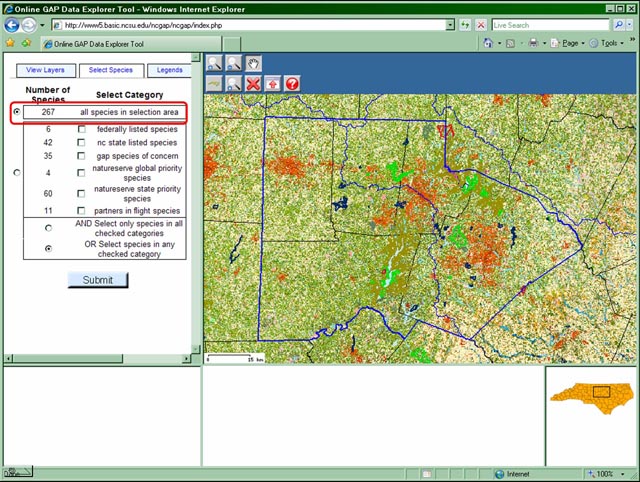
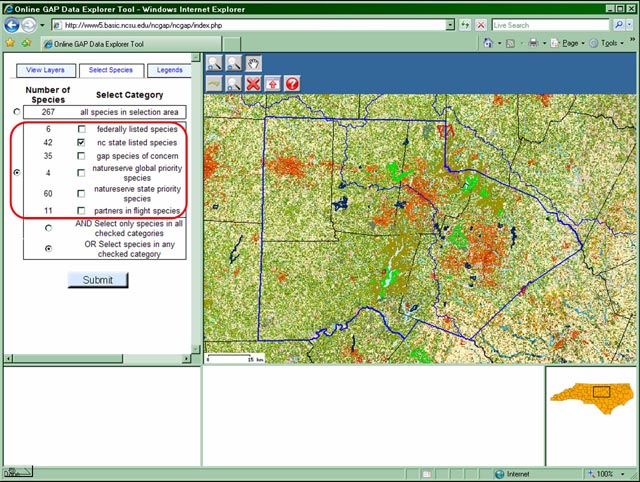
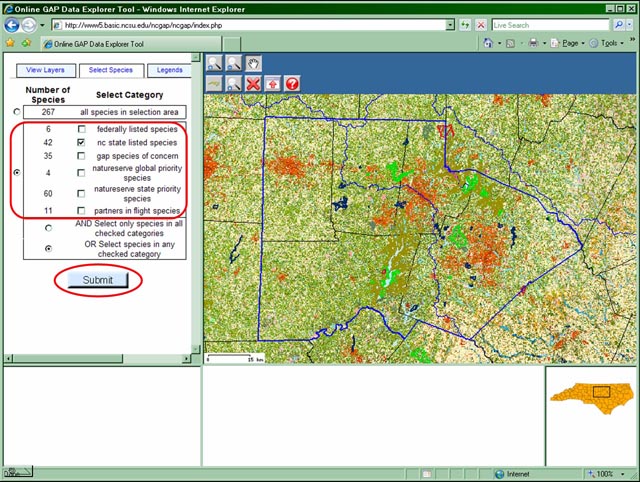
At this point, the 'Define AOI' tab becomes the 'Select Species' tab. All the species that have their known range intersect the AOI are identified and are tallied in the following categories – All Species, Federally Listed, State Listed, NatureServe Priority (> 4) and Partners In Flight Priority (> 23). Any combination of subcategories can be selected through the use of AND/OR logical operands. Once the user has selected what list to continue with, they select 'Submit'.
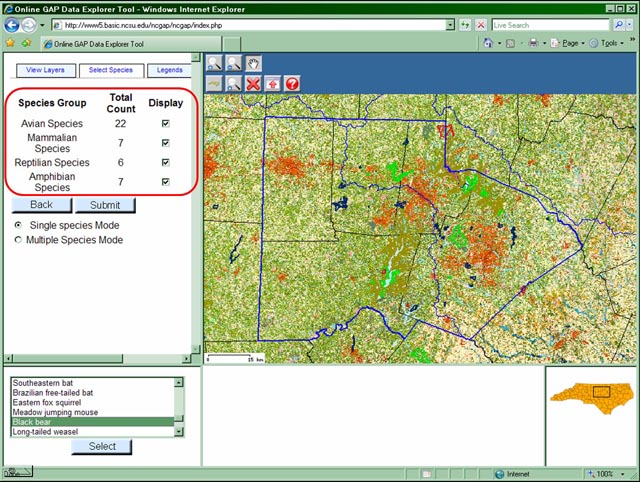
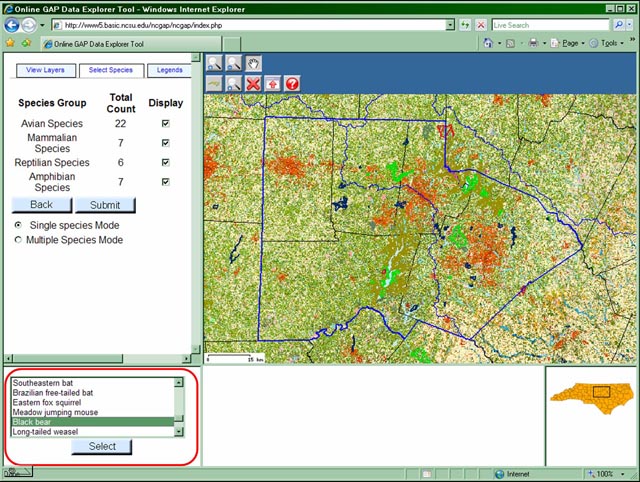
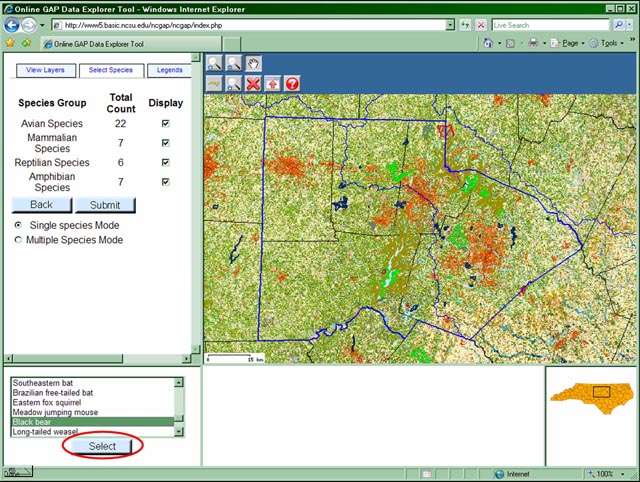
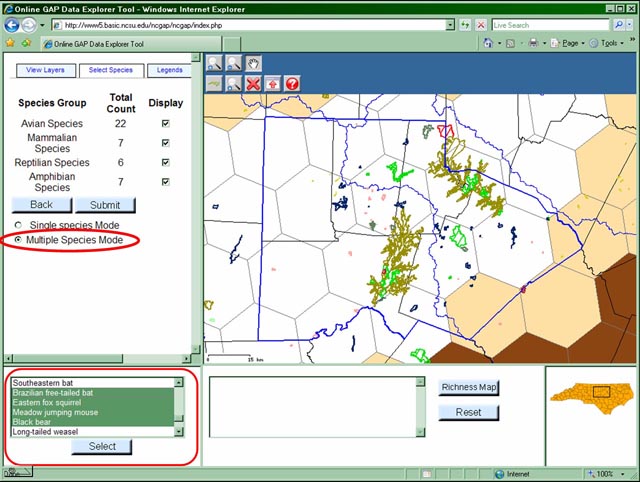
The submitted list of species is then quantified by taxa. This is done to allow the user to reduce the number of species being listed in the Species List Frame. There are two modes - Single Species and Multiple Species. Single Species Mode is the default. To continue, the user must select a species.
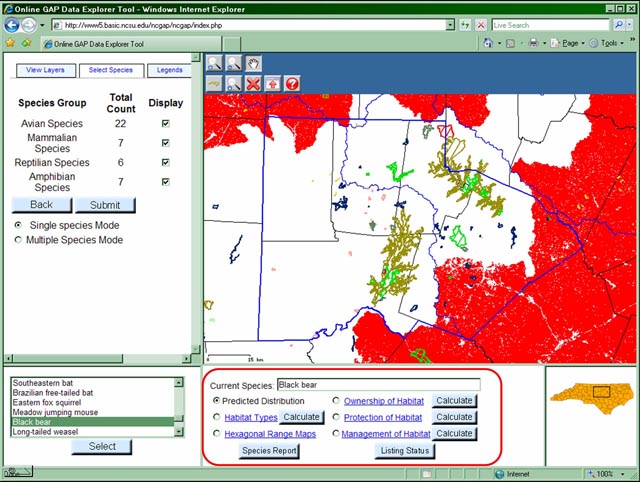
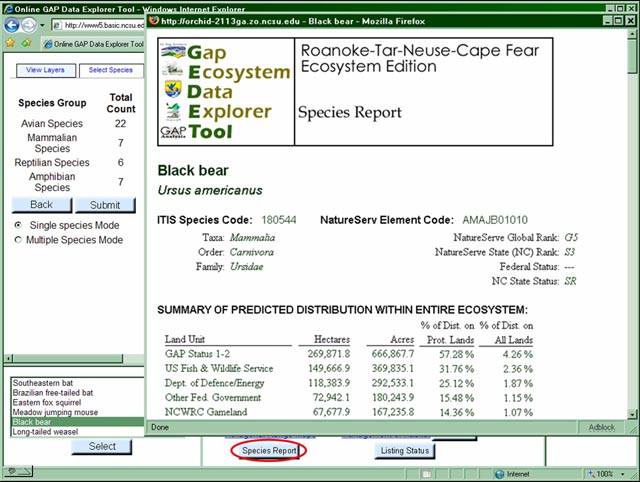
The selected species predicted distribution map is displayed by default. Several other species specific tools are presented in the Tool Frame including Habitat Type, Known Range, Stewardship, Species Reports and Listing Status. In addition, the user can quantify several of those data layers for the AOI.
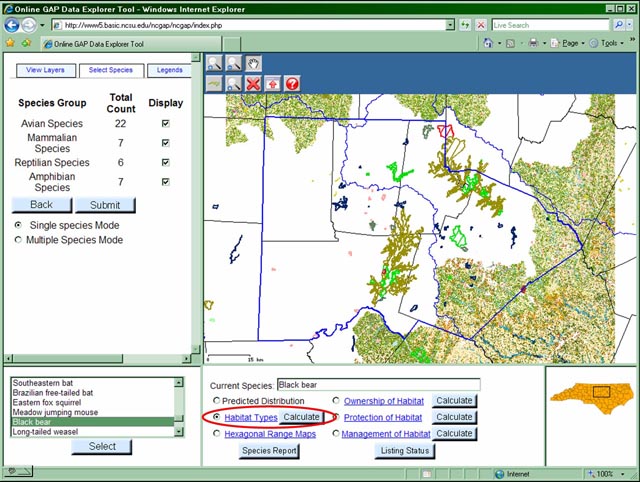
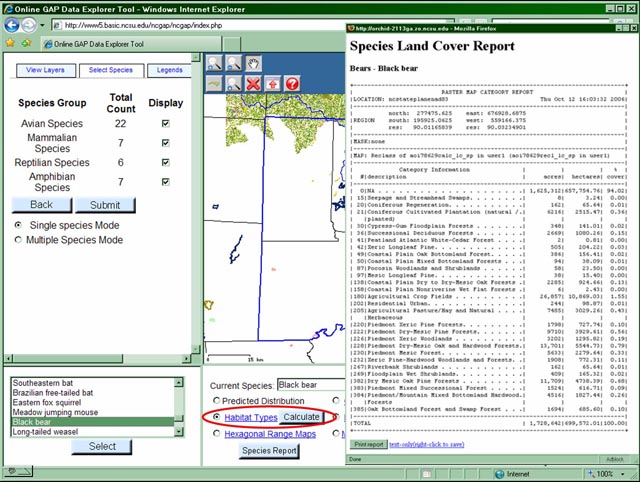
Habitat Type and Report
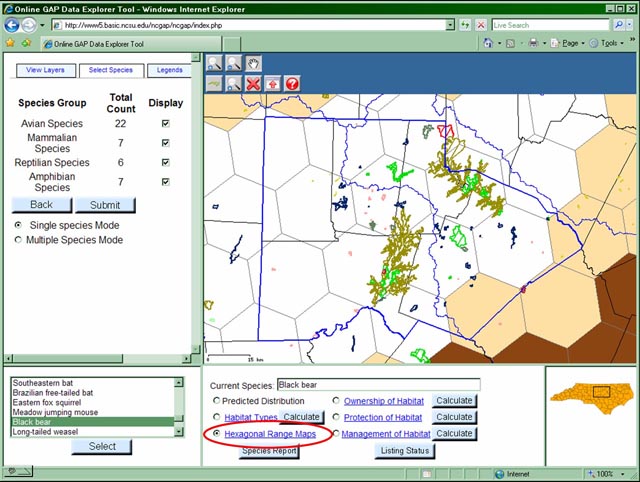
Known Range
Species Report
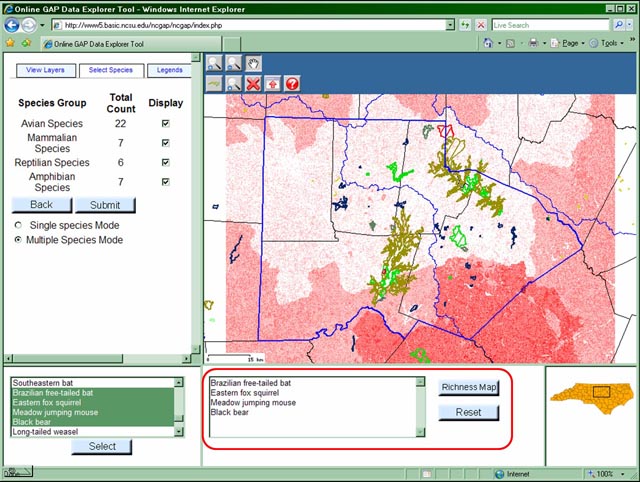
Multiple Species Mode allows the user to develop richness maps based on their selection of species.
Richness map for 4 species.