Digital Aerial Photography Library
Overview
Using digital photographic equipment, airborne GPS, and a rectification process, a library of digital aerial photography was developed. Using the photography library, points were interpreted using both the NLCD 2001 and Ecological Systems classification schemes. This library of interpreted points was used to aid in both NLCD and Gap-level mapping efforts.
Procedures
Flight LinesFlight lines for aerial photography collection were oriented from northeast to southwest across the Southeastern U.S. and perpendicularly from northwest to southeast at 1/2 arc degree spacing. Lines were arranged this way to efficently cover the 10 mapping zones of the southeast, which are oriented generally northeast to southwest. This procedure ensures the best representation of data across any combination of satellite images used to create the mapping zone mosaics. The finalized flight lines cover portions of Kentucky, Tennessee, Virginia, North Carolina, South Carolina, Georgia, Alabama, Mississppi, Louisiana, and Florida.
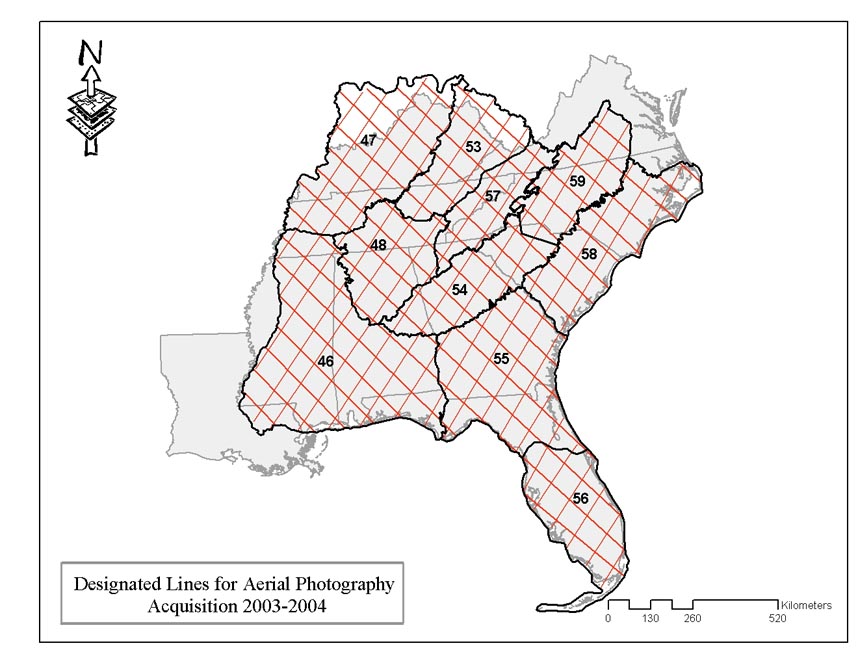 |
Flight lines for Southeast GAP digital aerial photography collection. To see a larger map, click the image above. |
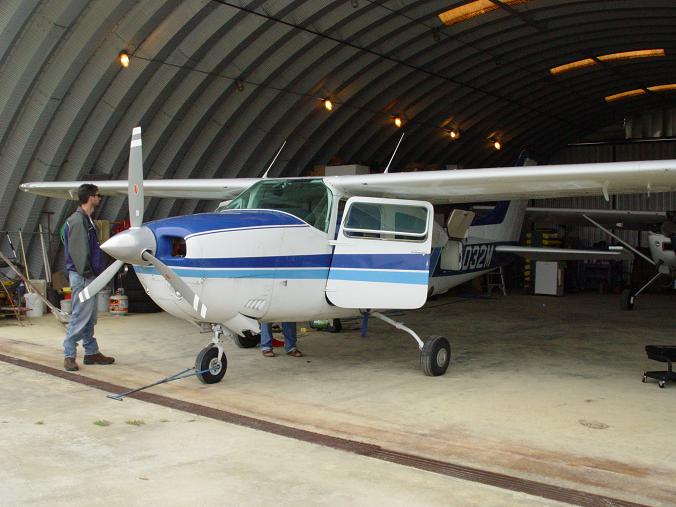
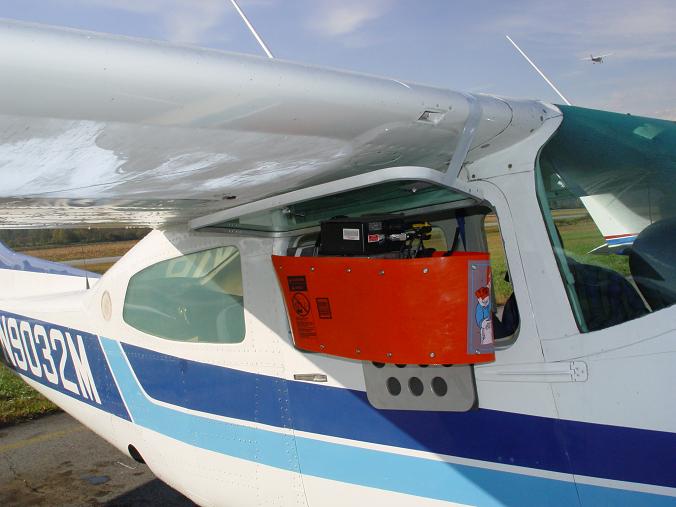
The majority of the flight lines were flown in a Cessna 210 Centurion, with a window mounted sensor array (figures 2-4). The sensor array was modified from a dual Hi-8 video camera system to contain a digital still camera as well as a digital video camera.
 |
 |
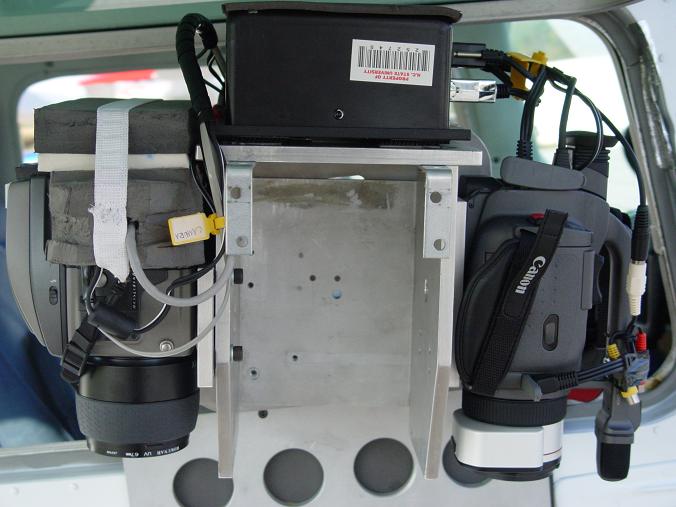 |
From left to right: Cessna 210 Centurion in hanger, Sensor array mounted with wind cowling, arrangement of sensors inside the array. Click an image to see a larger picture. | ||
In addition to the cameras, a GPS unit was employed to record the geographic location of the airplane; an Inertial Measurement Unit (IMU) was employed to record the rotational parameters of the airplane's attitude, and, when available, a laser range finder recorded the airplane's height above mean sea level (MSL). To synchronize the data recorded during photo missions, data logging software (ComCap) recorded a time stamp with each of the sensor inputs, relating camera frames to geographic locations as well as the airplanes attitude.
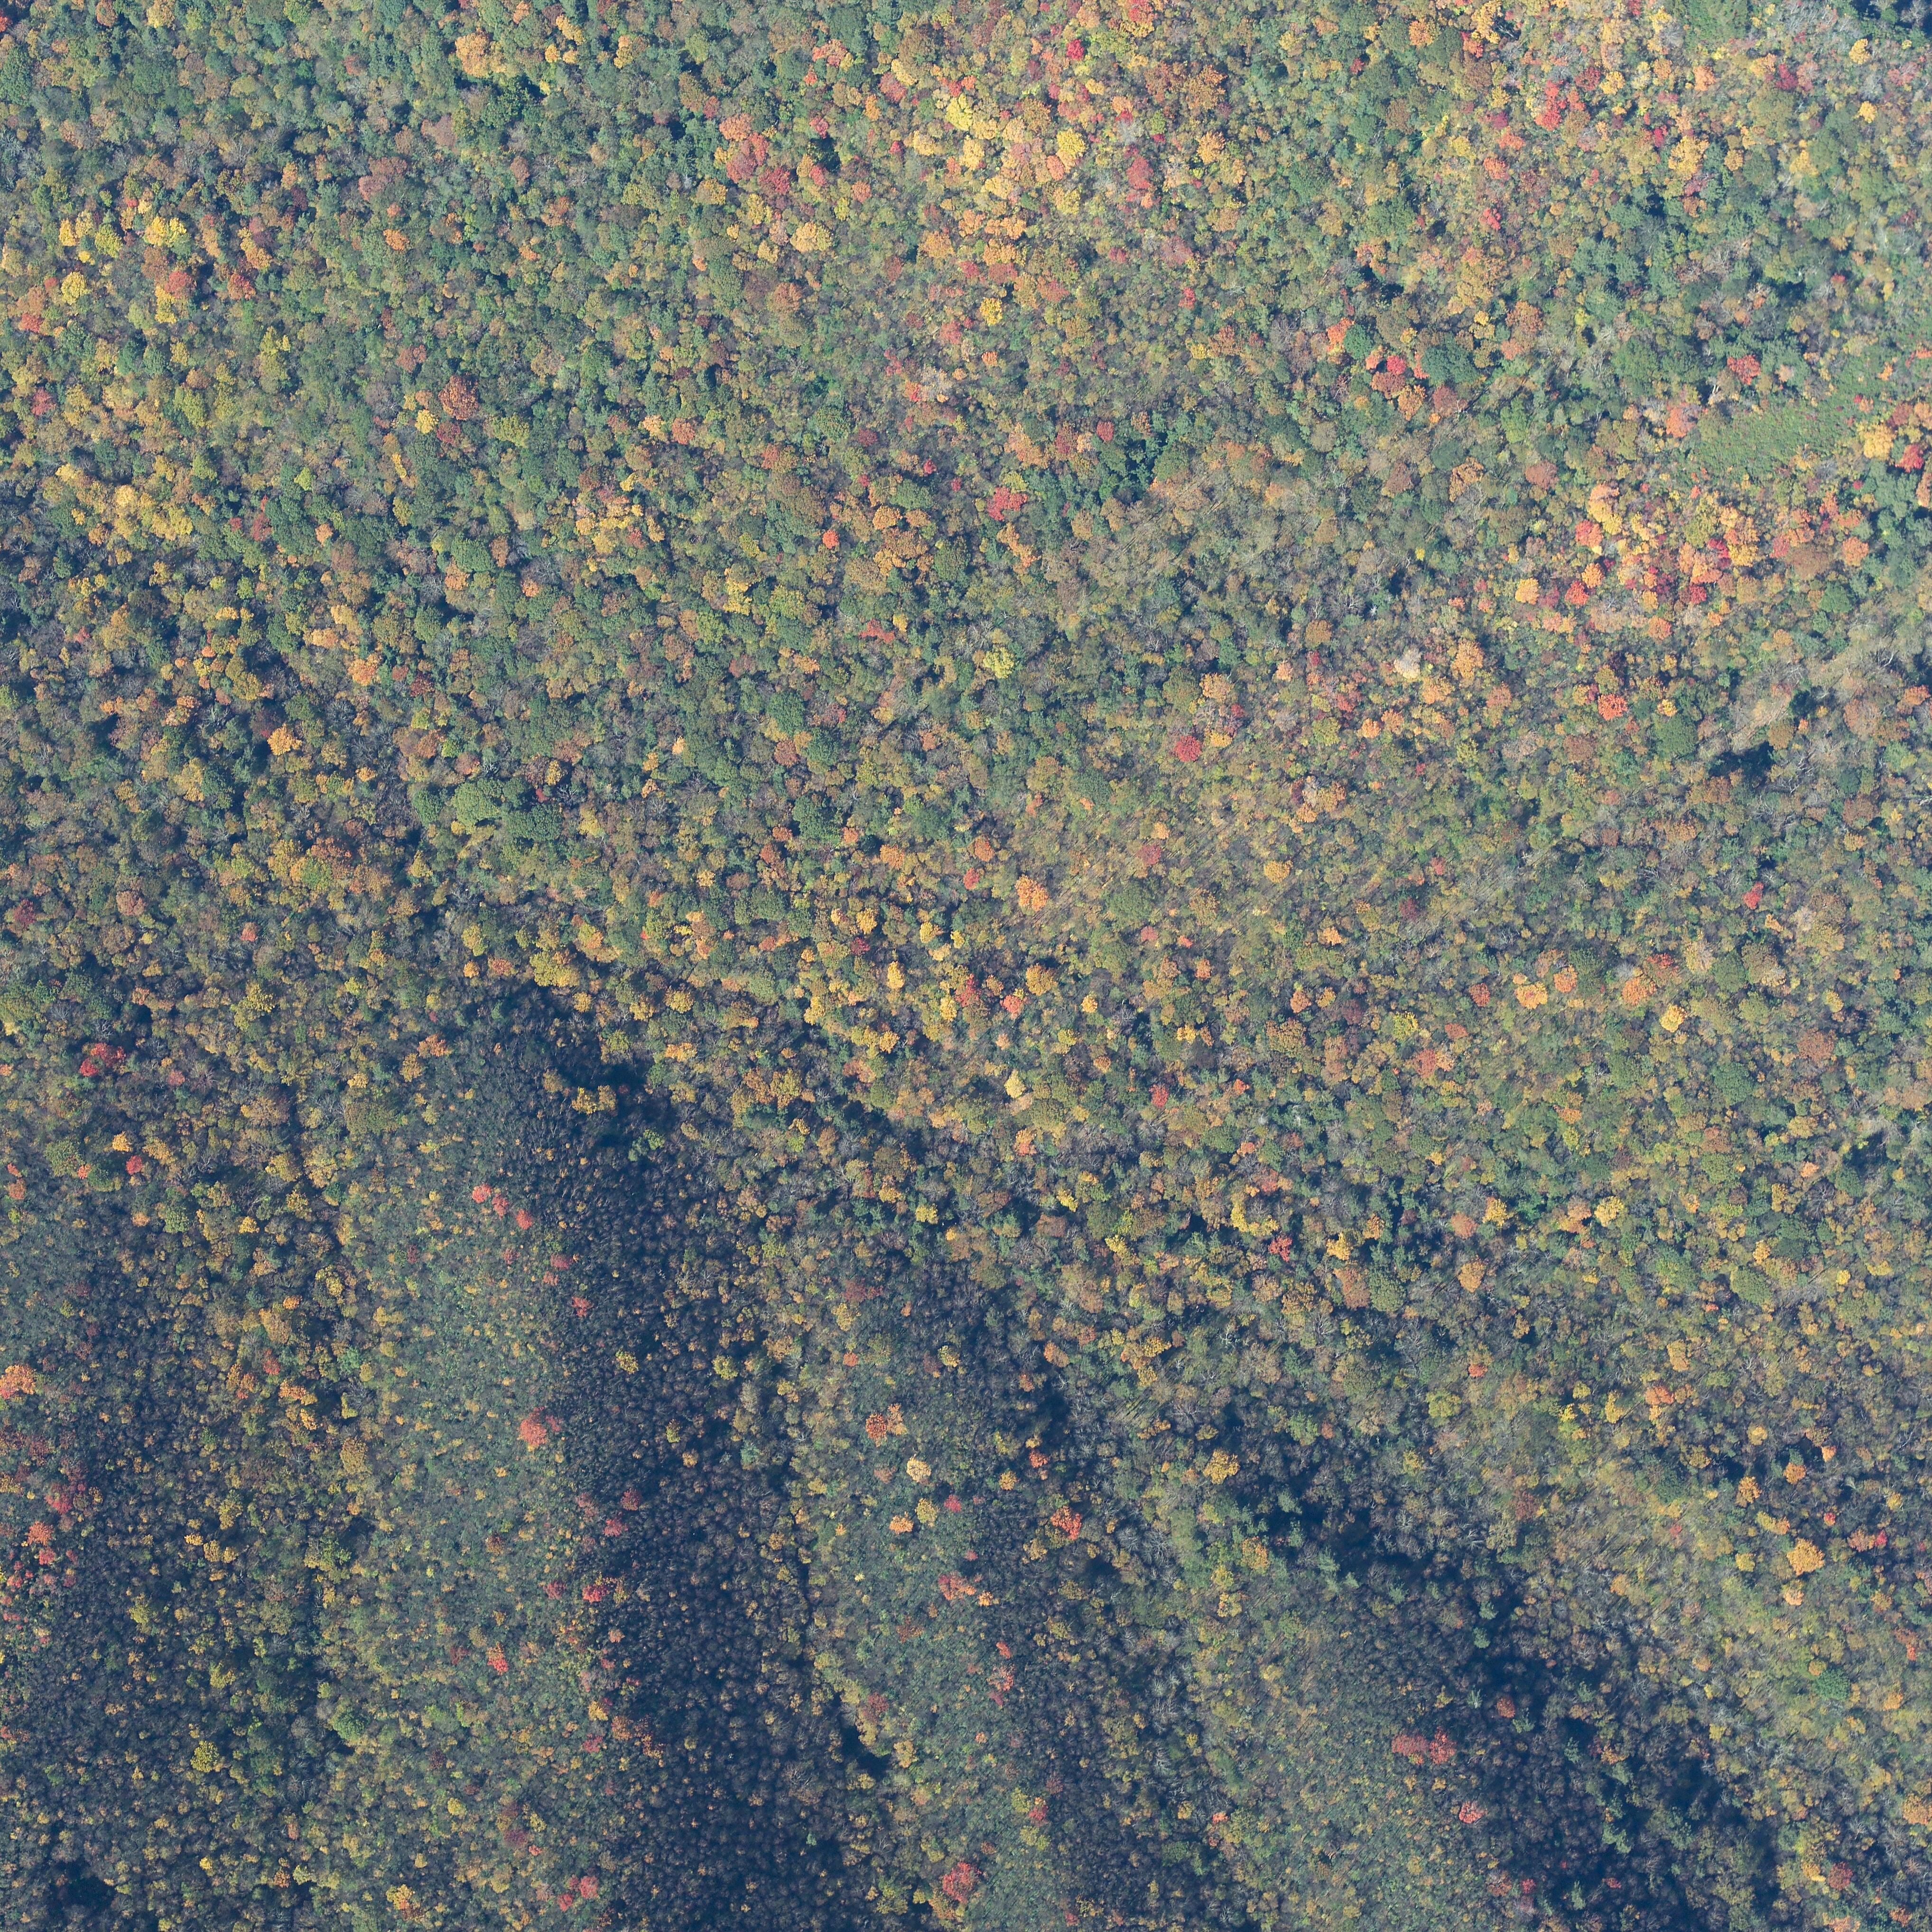 |
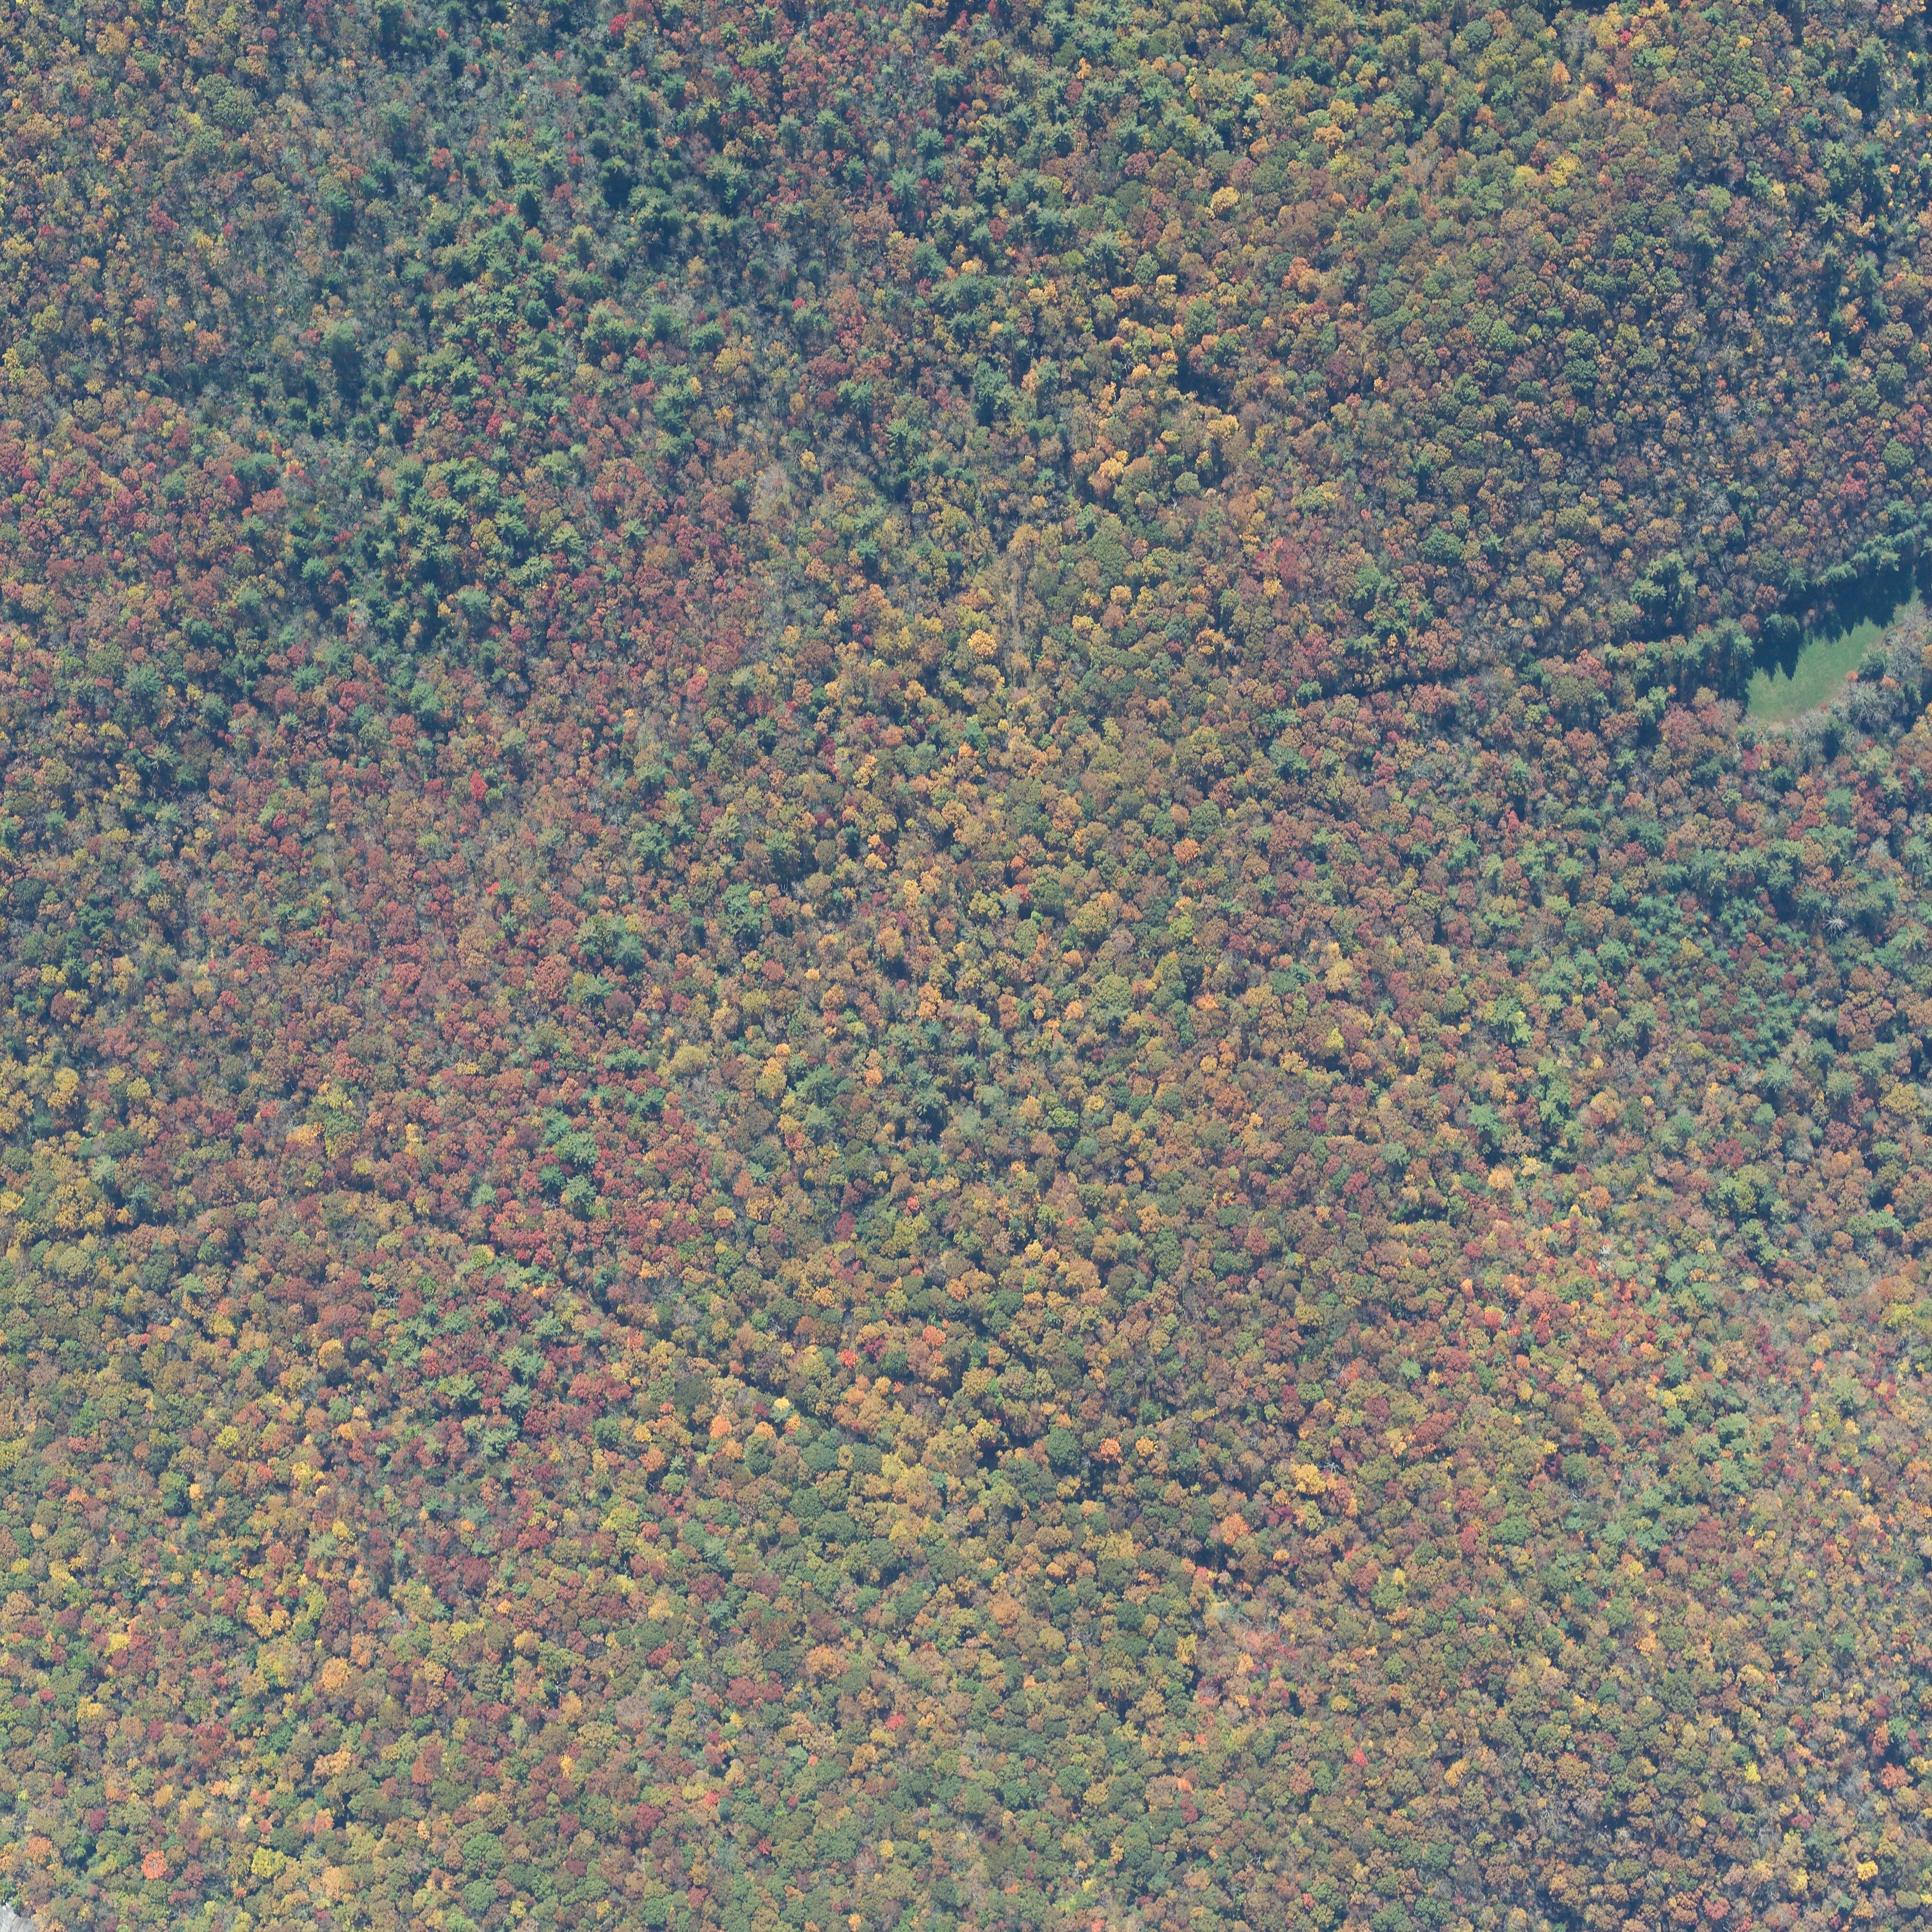 |
Digital aerial photographs taken in mid October capturing peak leaf change. Click either image to see the original image (9,400 KB). | |
Flight lines were flown with a target height above ground between 1067m (3500') and 1372m (4500'). Coupled with an 80mm camera lens, photograph extents covered approximately 360,000 square meters (600m x 600m). The 16 million pixel CCD allowed a 0.2m/pixel resolution for the still camera. Photos were taken every ten seconds which allowed a ten percent overlap in photos providing a continuous swath throughout the flightline. Flights were scheduled during either spring or fall to maximize differences in leaf morphologies between tree species.
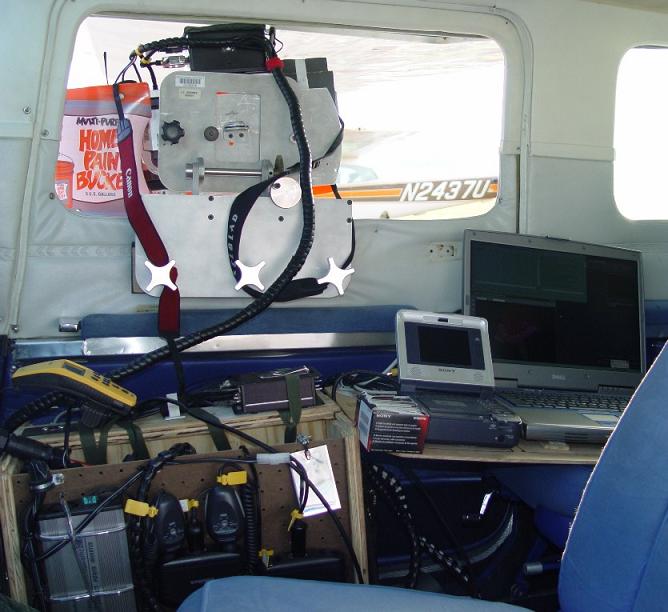 |
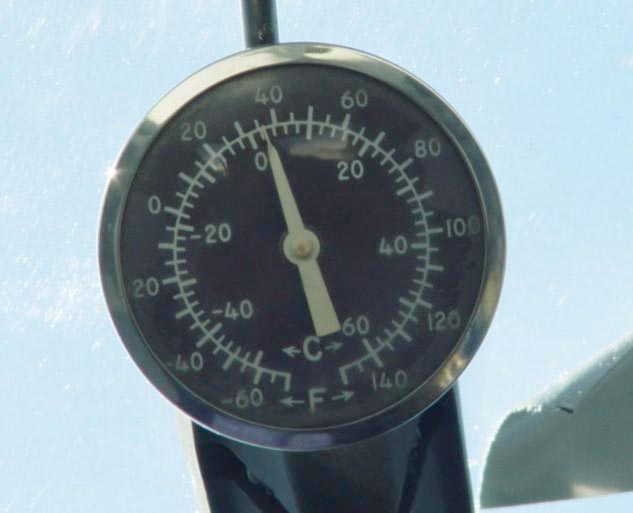 |
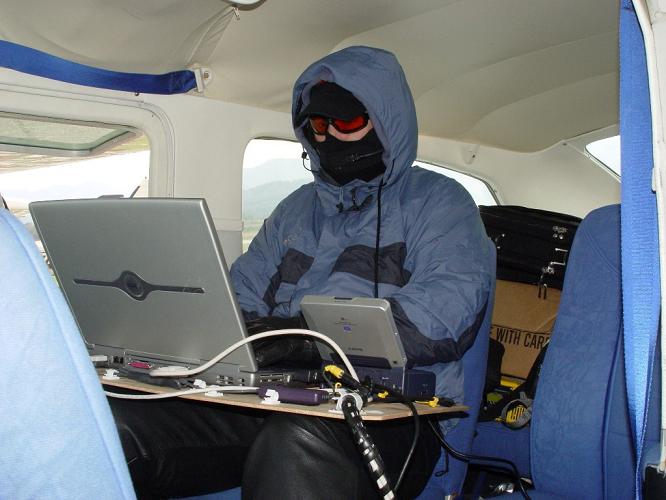 |
From left to right: Sensor array from inside the cockpit, Air temp outside of the plane in mid-October at 4400' in the Blue Ridge, Curtis Belyea bundles up to monitor the equipment during a photography mission. Click an image to see a larger picture. | ||
Between August and December of 2003, ninety-five (95) hours of flying captured over thirty-three thousand (33,000) digital images. A representation of the actual flight lines can be seen in the image below.
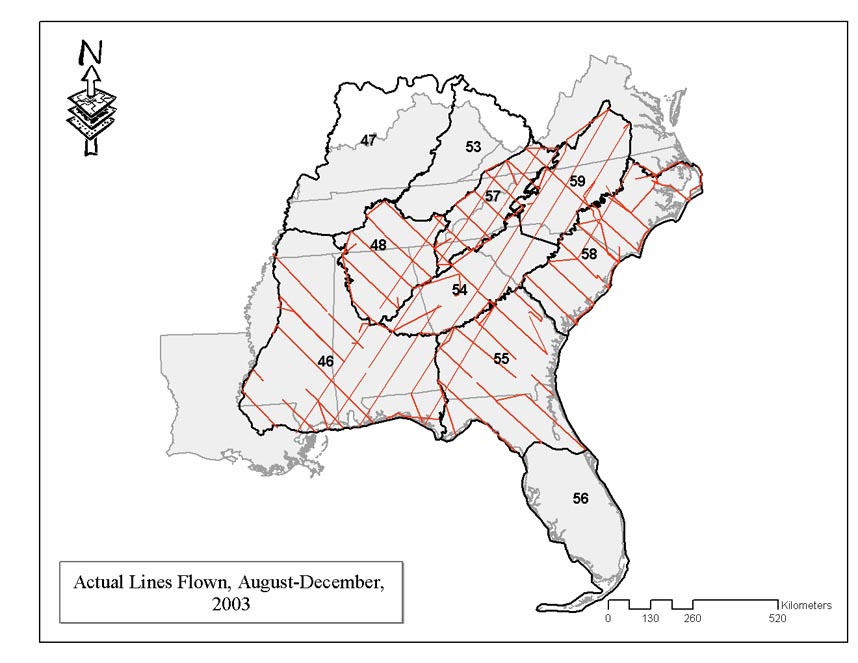 |
Actual lines flown between August and December, 2003. To see a larger map, click the image above. |
Rectification software developed by the NaRSAL lab at UGA converts the images from a proprietary image format (DCR) to tagged image file format (TIFF) and creates world files based on the data collected from the sensors. The resultant images are georeferenced and can be used in a Geographic Information System to aid in land cover classification efforts. An example photo pair from the orthorectification process can be found below.
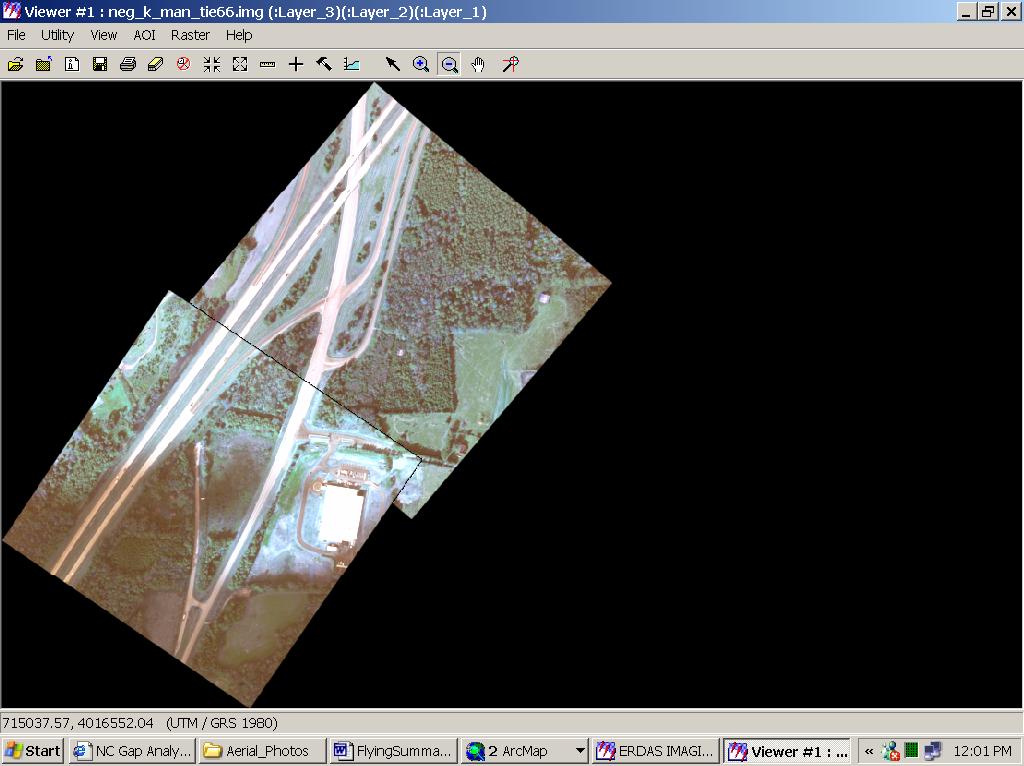 |
Two orthorectified aerial still photos. To see a larger map, click the image above. |
Photo Interpretation
As the first step toward regional mapping, an extensive database of interpreted points using the digital aerial photographic library was created. The National Land Cover Dataset protocol suggests a minimum of 250 reference data points for common map classes and 50 points for rare classes for use in the Categorical and Regression Tree Analysis procedure. In order to gather 250 points for each of the fourteen non-urban cover classes, a minimum of 3500 points per mapping zone were required. Care was be taken to stratify the points over the spectral variation in each class.