Avian Modeling Pilot Project with USFWS
Project Description
The Biodiversity and Spatial Information Center (BaSIC) at NC State University has partnered with the U.S. Fish and Wildlife Service (USFWS) to explore the potential of enhancing GAP vertebrate models in the southeastern U.S. (Southeast Gap Analysis Project) to address specific needs of the avian conservation community. The partnership benefits from high quality datasets and spatial modeling expertise offered by BaSIC, as well as from the network of USFWS biologists available to coordinate expert review and link the modeling work directly to management and monitoring activities. The primary goal of this research is to develop a scientifically rigorous framework for iteratively improving predictions of species distribution patterns. In addition, BaSIC is working with state, regional and national partners to improve techniques for mapping habitat suitability (Figure 1). After these methods are developed for a few species within a pilot study region, they will be applied to the 9 state SE-GAP region and may be expanded to include more species and/or spatially explicit population dynamics. The pilot project focuses on six bird species occurring along a shrub-forest gradient of landscape characterization within the North Carolina portion of the Appalachian Mountains Bird Conservation Region. A team of local experts selected these species in part because they were listed as priority species for monitoring and/or conservation efforts by Partners in Flight (Rich et al. 2004). Efforts will focus on 1) determining which SE-GAP species distribution model inputs have the greatest influence in predicting species' occurrences areas; 2) developing an extensive database of spatially explicit species-habitat-population relationships, 3) incorporating knowledge of habitat suitability, which is critical in setting conservation goals and objectives, into traditional presence/absence predictions; 4) assimilating existing bird survey records from multiple sources into a spatially explicit database: 5) validating North Carolina GAP and SE-GAP species distribution models; and 6) extrapolating and validating bird species occurrences using occurrence data and state-of-the-art techniques.
Return to Top
Background
In September 2004, a meeting of regional biologists and modelers was hosted by the USFWS in Atlanta, GA to review a variety modeling approaches and the datasets available for modeling in the Southeast. The objectives of the meeting were to:
- Inform partners about current regional modeling efforts by the USFWS and BaSIC.
- Get feedback on preliminary efforts to match functional ecological systems (Comer et. al. 2003) with mappable land cover categories.
- Identify priority bird species.
- Review existing avian models for those species.
- Provide background on ancillary data available for use in modeling.
- Identify additional ancillary data that would be helpful for modeling efforts.
- Receive feedback from partners on additional methods/data that could be used to improve modeling.
At the meeting, presentations by the Mississippi Alluvial Valley Joint Venture office (MAV-JV) and the Upper Midwest Environmental Sciences Center (UMESC), as well as BaSIC described a range of modeling approaches that could be taken. Some of the feedback obtained at the meeting resulted in modifications and enhancements to the ancillary datasets developed for use in GAP models. USFWS biologists also declared interest in expanding the use of science-based modeling for conservation planning efforts. In particular, there was a desire to identify areas on the landscape that are either currently suitable for priority bird species or could be managed to improve the suitability. Scaling factors were requested for some model parameters so areas could be ranked with respect to habitat quality. The audience was also adamant about the need to quantify the sensitivity of prediction accuracies to model variables and thresholds. These recommendations were compiled and evaluated for their utility to increase the accuracy and information content of occurrence predictions. A pilot project was then established to develop and implement these enhancements to current SE-GAP modeling efforts.
A meeting in Asheville was used to help refine the pilot project objectives and list of focal species. Meeting participants included regional researchers, managers and bird species experts. To reduce computer processing times, it was decided to limit the pilot project study region to the portion of the Appalachian Mountains Bird Conservation Region falling within North Carolina. The focal bird species list was also reduced to six to simplify the project. Focal species' habitat associations span a wide range of forest age and structure. Reasons for species selection included priority listing by Partners in Flight and because most changes in landscape composition and structure in the revised study region area are associated with forest loss or conversion due to timber harvesting and residential development. The final list of focal species for the pilot project includes:
Study Species
- Acadian Flycatcher (Empidonax virescens)
- Golden-winged Warbler (Vermivora chrysoptera)
- Hooded Warber (Wilsonia citrina)
- Scarlet Tanager (Piranga olivacea)
- Worm-eating Warbler (Helmitheros vermivorus)
- Yellow-breasted Chat (Icteria virens)
Return to Top
Objectives
- Develop a map of avicentric land cover classes to define landscape composition in a way that may be more relevant to birds than existing land cover classes
- Develop a database of spatially explicit species-habitat associations and population responses described in the literature.
- Conduct sensitivity analysis on input map layers used to make SE-GAP predictions of species' occurrences.
- Create habitat suitability models based on expert rankings of species- habitat associations.
- Locate and integrate various bird inventories for knowledge-based model validation.
- Extrapolate and validate bird occurrences using existing inventories and state-of-the-art techniques.
Literature Review Database
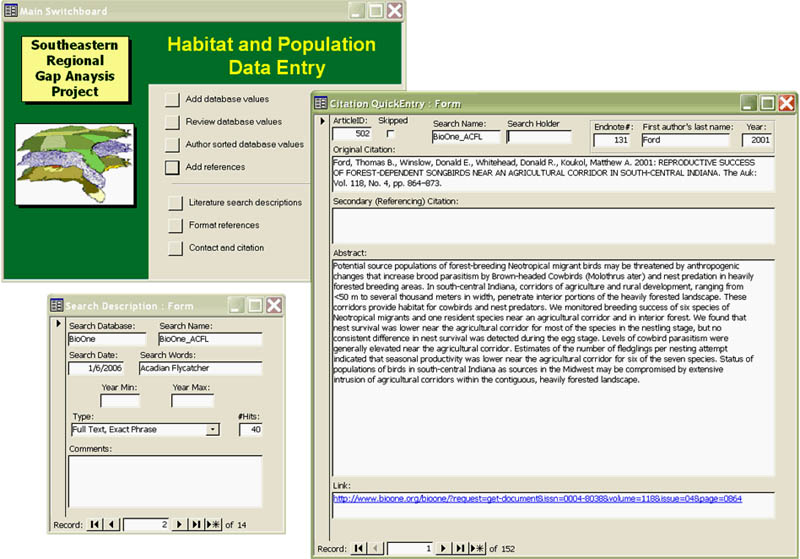
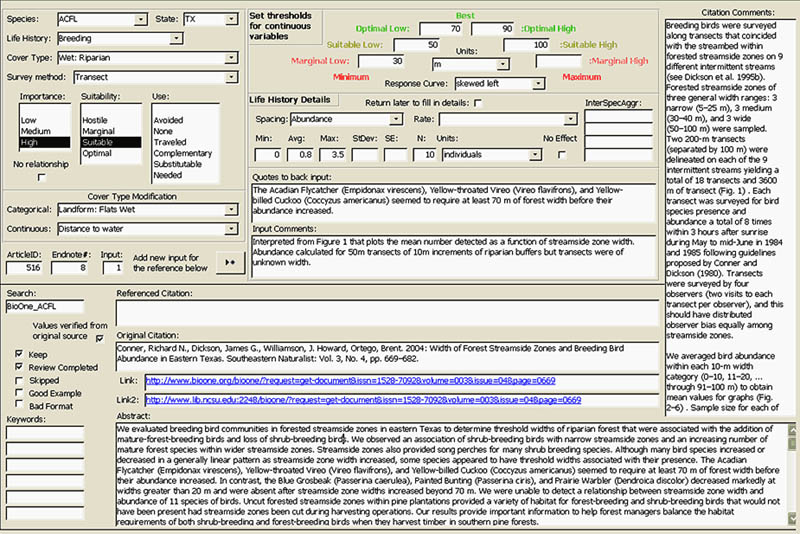
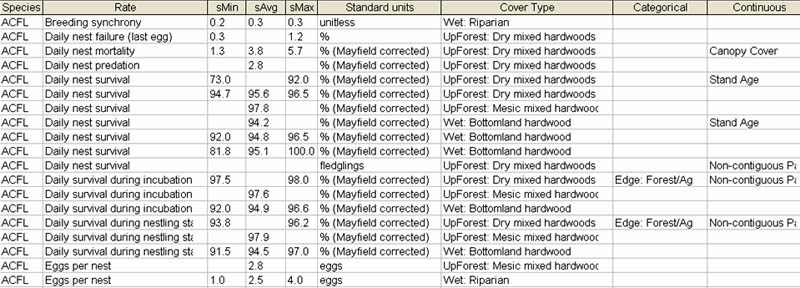
Literature reviews of species-habitat relationships are conducted everyday for the purpose of scientific research and management. These efforts are generally inefficient as they are rarely documented and often repeated. Furthermore, information gleaned from the reviews is commonly summarized as text descriptions that cannot be queried or summarized in different ways for other purposes. BaSIC is currently developing a new method of documenting literature reviews by multiple persons that creates synergy from their activities through the use of a relational database and the Internet. BaSIC created database forms to record details of literature searches and research results. Details captured in the forms are spatially and temporally explicit and divided into modular units. In this way, each record of the database can be queried for information describing the study’s date and location, method of data collection, species studied, land cover types and landscape relationships (e.g., patch size, distance to water), as well as qualitative descriptions of habitat suitability and quantitative demographic parameters (e.g., density, mating success, daily nest survival, nest predation rates) under those conditions. Additional queries allow these data to be standardized and summarized in different ways. Efforts are currently underway to make the forms and queries available on-line so that the conservation community may work together to limit redundant efforts and build a robust repository of research results descriptions. Examples of database forms (Figures 2 & 3) and possible quesries (Figure 4) are provided below.
Avicentric Classes
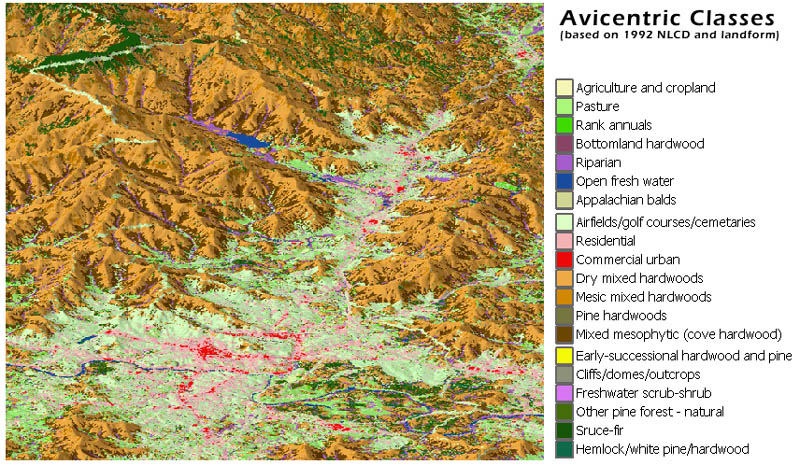
Landscape analyses of species-habitat associations should be conducted using maps representing functional differences in how focal species perceive and respond to landscape composition and structure. For this reason, USFWS has generated a list of avicentric land cover classes to spatially partition the southeast region. These classes were mapped for the study region using a combination of available data layers. In particular, National Land Cover Data (NLCD) were intersected with 16 landform classes. The resulting groups were aggregated and/or reclassified into avicentric classes (Figure 5).
| Avicentric land cover classes. | ||||
| Community Name | Level 1 | Level 2 | Level 3 | Code |
| Eastern Grasslands | I | 10000 | ||
| Tamaulipan Prairie | I | A | 10100 | |
| Tall Grass | I | B | 10200 | |
| Meadows / Florida and Georgia Prairies | I | C | 10300 | |
| Agricultural and Cropland | I | D | 10400 | |
| Pasture | I | E | 10500 | |
| Rank Annuals | I | F | 10600 | |
| Freshwater Wetland Communities | II | 20000 | ||
| Non-Forested | II | A | 20100 | |
| Freshwater Emergent Marsh | II | A | 1 | 20101 |
| Bogs / Fens / Ephemeral Wetlands | II | A | 2 | 20102 |
| Mudflats / Sandbars | II | A | 3 | 20103 |
| Forested | II | B | 20200 | |
| Bottomland Hardwood | II | B | 1 | 20201 |
| Cypress-Tupelo | II | B | 2 | 20202 |
| Atlantic White Cedar | II | B | 3 | 20203 |
| Pocosin / Carolina Bays | II | B | 4 | 20204 |
| Riparian | II | C | 20300 | |
| Open Fresh Water | II | D | 20400 | |
| Coastal Communitites | IV | 40000 | ||
| Maritime Shrub-Scrub | IV | A | 40100 | |
| Maritime Forest | IV | B | 40200 | |
| Chenier / Oak Motte | IV | C | 40300 | |
| Estuarine Emergent Marsh | IV | D | 40400 | |
| Beaches and Dunes | IV | E | 40500 | |
| Tidal Mudflats | IV | F | 40600 | |
| Coastal Prairie | IV | G | 40700 | |
| Mangroves | IV | H | 40800 | |
| Pine Communities | V | 50000 | ||
| Pine Flatwoods | V | A | 50100 | |
| Pine Savanna | V | B | 50200 | |
| Xeric Pine Scrub | V | C | 50300 | |
| Pine Plantations | V | D | 50400 | |
| Other Pine Forest | V | E | 50500 | |
| Other Pine Forest - Natural | V | E | 50501 | |
| Pine Sandhills | V | F | 50600 | |
| Upland Hardwood / Pine-Hardwood Communities | VI | 60000 | ||
| Spruce-Fir | VI | A | 60100 | |
| Northern Hardwood | VI | B | 60200 | |
| Mixed Mesophytic (Cove Hardwood) | VI | C | 60300 | |
| Hemlock / White Pine / Hardwood | VI | D | 60400 | |
| High Elevation Oak / Oak-Pine | VI | E | 60500 | |
| Mixed Hardwoods | VI | F | 60600 | |
| Dry Mixed Hardwoods | VI | F | 1 | 60601 |
| Mesic Mixed Hardwoods | VI | F | 2 | 60602 |
| Pine Hardwoods | VI | G | 60700 | |
| Oak-Cedar | VI | H | 60800 | |
| Oak Savanna | VI | I | 60900 | |
| Hardwood Plantation | VI | J | 61000 | |
| Tropical Hardwoods | VI | K | 61100 | |
| Pelagic | VII | 70000 | ||
| Continental Shelf | VII | A | 70100 | |
| Deep Open Water | VII | B | 70200 | |
| Gulf Stream | VII | C | 70300 | |
| Cities / Towns / Suburbs | VIII | 80000 | ||
| Residential | VIII | A | 80100 | |
| Commercial Urban | VIII | B | 80200 | |
| Airfields / Golf Courses / Cemeteries | VIII | C | 80300 | |
| Additional classes | IX | 90000 | ||
| Quarry / Strip Mines / Gravel Pits | IX | A | 90100 | |
Return to Top
Sensitivity Analysis
Each input data layer associated with species' occurrences will be assessed for its influence on modeled occupancy areas. For example, if a species known to occur within 100m of water, this occupancy rule will be tested for its independent contribution to the total area classified as species presence by the model. Independent contributions of each model parameter will be summarized for all species to identify parameters commonly making large contributions to model predictions.
The influence of map errors on model predictions will also be assessed. Map errors under consideration include both spatial errors and compositional errors. For example, we will reclassify random pixels as land cover classes in proportion to the cell frequency of correctly and incorrectly classified pixels in the confusion matrix of the land cover map to induce intrinsic spatial error into land cover descriptions. Compositional errors will be induced in several ways. For example, a low-pass filter may be applied to the land cover map to investigate the effects of land cover spatial precision on model output.
Return to TopHabitat Suitability Models
Spatial models based on habitat affinities derived from the literature review database and expert review will be created for each of the priority bird species. Data layers of traditional Boolean GAP models depicting presence/absence will be ranked into suitability levels. Categorical variables (avicentric classes and their categorical modifiers) will be ranked directly. Continuous variables will first be coded as having one of many possible response curves (Figure 6). Thresholds of suitability along the response curve will then be set. The ranked data layers will then be summarized to describe spatial gradients of habitat suitability for focal species across the study region. Besides suitability, simple qualitative descriptions of variable importance and use will also be recorded when possible. Below are more detailed descriptions:
- Low - species will modify its behavior under this condition but effect on survival or reproduction is minimal to nil.
- Med - species will modify its behavior under this condition with some affect on survival or reproduction.
- High - Conditions have a strong influence on survival or reproduction.
- Hostile - Conditions have some negative impact on survival or reproduction.
- Marginal - Conditions have some small positive impact on survival.
- Suitable - Average conditions for continued survival and successful reproduction.
- Optimal - Best case conditions for survival and reproduction.
- Avoided - Species actively avoids (purposefully selects against proximity to) the condition.
- None - The condition may be important but the species does not alter its behavior under this condition.
- Traveled - The species does not use or alter its behavior under this condition but will travel through it without hesitation to get to a preferred condition.
- Complimentary - The condition provides additional resources when in combination with a more important condition. However, the condition is not necessary for survival or reproduction.
- Substitutable - The condition is necessary for survival or reproduction but a different condition could fill the same role.
- Needed - The condition is absolutely necessary for species survival and/or reproduction and no other condition can fill that role.
Return to Top
Locate and Integrate Data
In order to validate SE-GAP presence/absence maps and create a repository of data for the development of more sophisticated data-driven models, occurrence data are being collected and organized for the priority species throughout the three state study region. Data sources so far include NC Wildlife Resources Commission, Dr. Ted Simons, state breeding bird atlases, the USGS Breeding Bird Survey, local Natural Heritage Programs' element occurrences, R8Bird data collected by the U.S. Forest Service, data from the Monitoring Avian Productivity and Survivorship program, museum records and any other digital data sets that may become available. These diverse data will be imported into a relational database to derive spatially and statistically appropriate datasets for model creation and validation.
Return to TopData-driven models
Several powerful techniques have recently become available for extrapolating wildlife distribution patterns using relationships between locations where species have been observed and mapped environmental conditions at those locations. Environmental data available for modeling include data sets already being complied by SE-GAP (disturbance, canopy closure, imperviousness, distance to water, elevation, slope, etc.). Other regional data sets to be acquired include rainfall, temperature and frost-free days among others. Important predictors for individual species can be identified by several methods including principal components analysis, hierarchical partitioning (Mac Nally 2002), classification and regression tree analysis (CART; De'Ath and Fabricius 2000), as well as expert opinion.
Using these new modeling techniques, locations that have not been surveyed will be labeled for species presence or absence based on their "similarity" to surveyed locations where species were or were not detected. However, the techniques differ in how "similarity" is defined as well as their predictive accuracies and interpretability of the mechanisms behind the predicted patterns. For these reasons, SE-GAP will investigate the appropriateness of these techniques under different conservation objectives. Depending on data availability, some species will be selected for model development and evaluation. Only species with adequate data quality, quantity, and dispersion throughout the study area will be modeled. However, the "gap" in data availability for other species will be noted as a future research priority. Several inductive modeling techniques may be explored for each species including; "biophysical envelopes" such as DOMAIN (Carpenter et al. 1993) and PHASE1 (Laurent et al. 2005), multiple logistic regression, CART, and maximum entropy (Phillips et al. 2004) models. Each of these techniques has advantages and disadvantages which could make them suited for a particular species or data set. In addition, multiple models may be used for each species providing a more robust evaluation of habitat suitability including the possible use of deductive rules such as land cover use.
Return to TopHabitat Model Variables
- Land cover associations - 75 currently available as aggregated from 230 Ecological Systems by USFWS biologists
- Land cover derivatives
- Patch characteristics
- Min size
- Buffer in/out
- % in x hectares
- Edge Type
- Edge Width
- Patch characteristics
- Hydrography
- Buffer in/out
- Flowing water
- Standing water
- Wet vegetation
- Salinity (Fresh vs. Brackish vs. All)
- Stream Flow
- Accumulation (Min/Max)
- Velocity
- Buffer in/out
- Road Density (Low/Med/High)
- Elevation (Min/Max)
- Landform (Check boxes)
- Cliffs
- Steep slopes
- Slope crests
- Upper slopes
- Flat summits
- Side slopes
- Coves/Draws
- Dry flats
- Moist flats
- Wet flats
- Slope bottoms
Literature Cited:
Carpenter, G., A.N. Gillson, and J. Witmer. 1993. DOMAIN: a flexible modeling procedure for mapping potential distributions of plants and animals. Biodiversity and Conservation 2:667-680.Comer, P. D., Faber-Langendoen, R. Evans, S. Gawler, C. Josse, G. Kittel, S. Menard, M. Pyne, M. Reid, K. Schulz, K. Snow, and J. Teague. 2003. Ecological Systems of the United States: A Working Classification of U.S. Terrestrial Systems. NatureServe, Arlington, VA.
De'Ath, G. and K. E. Fabricius (2000). Classification and regression trees: a powerful yet simple technique for ecological data analysis. Ecology 81(11): 3178-3192.
Laurent, E.J., H. Shi, D. Gatziolis, J.B. LeBouton, M. Walters and J. Liu. (2005) Using the spectral and spatial precision of satellite imagery for analyses of wildlife distribution patterns. Remote Sensing of Environment 97:249-262.
Mac Nally, R. C. 2002. Multiple regression and inference in ecology and conservation biology: further comments on identifying inportant predictor variables. Biodiversity and Conservation 11: 1397-1401.
Phillips, S.J., J. Dudik, and R. E. Schapire. 2004. A maximum entropy approach to species distribution modeling. In Brodley, Carla E., editor. Machine Learning, Proceedings of the Twenty-first International Conference (ICML 2004), Banff, Canada, July 4-8, 2004. ACM Press, New York, NY.
Rich, T. D., C. J. Beardmore, H. Berlanga, P. J. Blancher, M. S. W. Bradstreet, G. S. Butcher, D. W. Demarest, E. H. Dunn, W. C. Hunter, E. E. Ińigo-Elias, J. A. Kennedy, A. M. Martell, A. O. Panjabi, D. N. Pashley, K. V. Rosenberg, C. M. Rustay, J. S. Wendt, T. C. Will. 2004. Partners in Flight North American Landbird Conservation Plan. Cornell Lab of Ornithology. Ithaca, NY.
Return to Top
For More Information:
| Contact: Dr. Ed Laurent | Contact: Steve Williams | |||
| Science Coordinator for the Bird Conservation Institute | Vertebrate Mapping Coordinator | |||
| NC Field Office, American Bird Conservancy | 220 David Clark Labs | |||
| Biodiversity and Spatial Information Center | ||||
| Department of Biology, NCSU | ||||
| Raleigh, NC 27695-7617 | ||||
| 919-513-7413 |
Last updated: Oct. 4, 2006